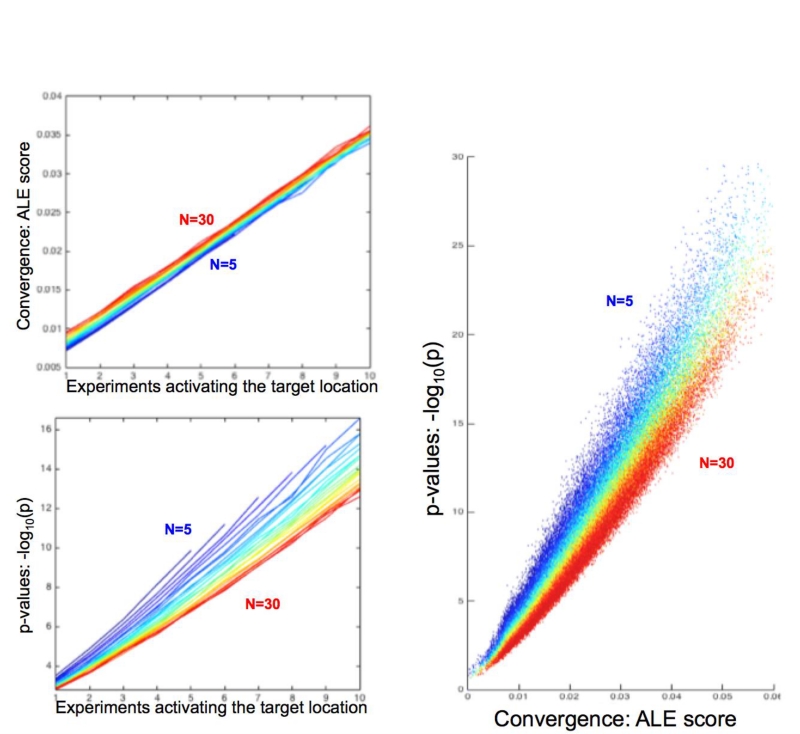
Figure 2.
Characteristic behavior of the ALE scores and the corresponding p-values under the different simulation conditions as observed across 122,500 simulated ALE analyses. The total number of experiments in the respective simulated ALE is coded in a spectral sequence from 5 experiments (dark blue) to 30 experiments (dark red). The top left panel shows the average ALE-score (across simulations) at the simulated location (again using the highest local maximum within 4 voxels of the “true” location). ALE scores increase with number of experiments due to additional contribution of noise from other unrelated foci. The bottom left panel shows the average p-value (across simulations) at the simulated location (using the highest local maximum within 4 voxels of the “true” location). It shows that given the same number of experiments activating at a particular location, lower total numbers of experiments (i.e., greater prevalence of activated experiments) yield lower p-values. The right panel demonstrates the inverse relationships evident from the left panels by plotting ALE scores vs. p-values for the simulated location (again using the highest local maximum within 4 voxels of the “true” location) for all 122,500 simulations. Higher total numbers of experiments lead to higher p-values for the same ALE scores or, conversely, require higher ALE scores for the same p-value.

