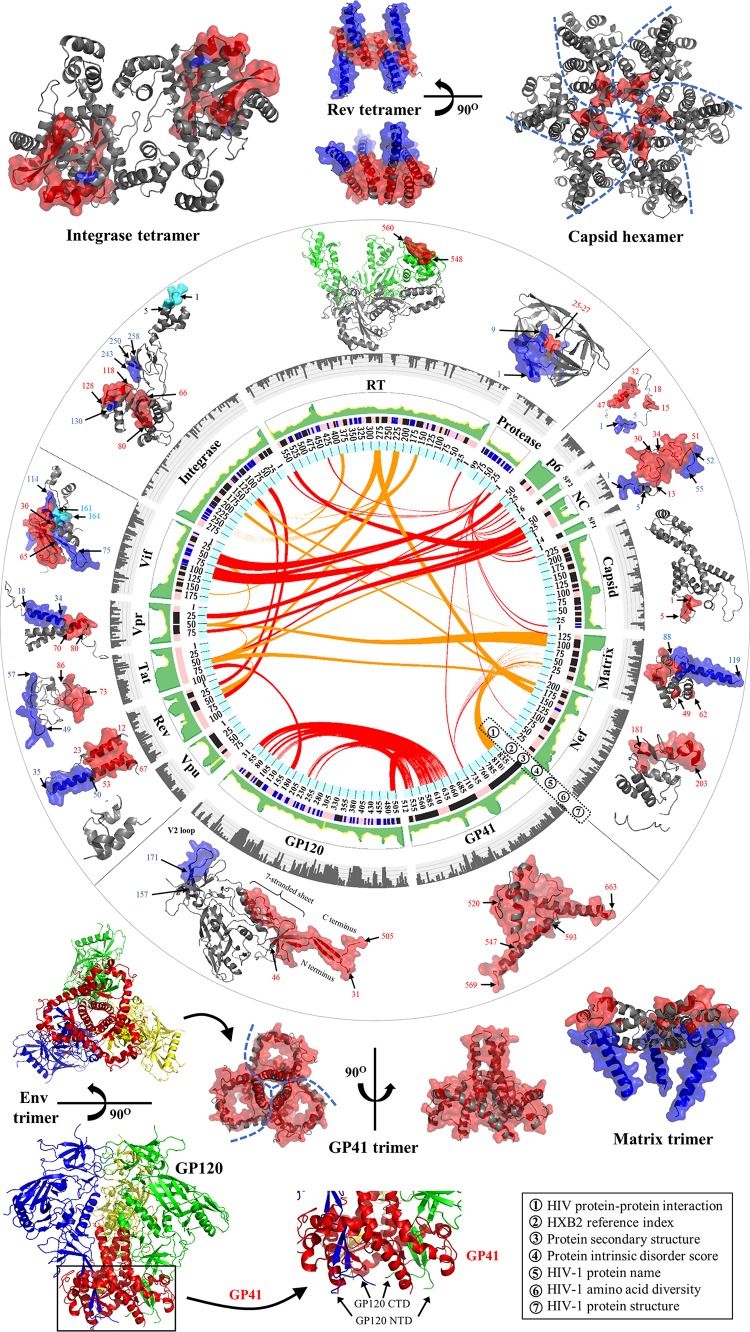
FIG 14.
Integrated map of HIV-1 pairwise protein interactions in the full-length genome. Fifteen HIV-1 proteins are plotted in a circle with seven layers. In layer 1, red links in the center indicate interaction domains for HIV-1 pairwise protein interactions (Table 1). Orange links indicate physical interactions between HIV-1 proteins, but their interaction domains are yet to be resolved (Table 1). In layer 2, indices of amino acid positions are annotated by using HIV-1 HXB2 as a reference. Layer 3 shows protein secondary structures (dark blue, helix structures; light blue, beta-strand structures; pink, random-coil structures) (44). In layer 4, intrinsic disorder scores of individual amino acid positions are shown in green. The range of intrinsic disorder scores is between 0 and 1 (the higher the value, the higher the structural variability) (44). In layer 5, 15 HIV-1 proteins have their names annotated accordingly. In layer 6, amino acid genetic diversity of the HIV-1 subtype B genome is exhibited in gray. Diversity values of between 0 and 1 are mapped on five sublayers (44). In layer 7, protein interaction domains are mapped on cartoon representations of crystallized HIV-1 protein structures. HIV-1 multimeric proteins are shown outside the circle. Data sets for HIV-1 intrinsic disorder scores and amino acid diversity were gathered from our recent report (44). Human proteins involved in HIV-1 pairwise protein associations are not illustrated. See Table S1 in the supplemental material for a list of PDB accession numbers used for structural visualization. PyMOL V1.7 (see http://www.pymol.org/) and Circos V0.64 (http://circos.ca/) visualization software were used.

