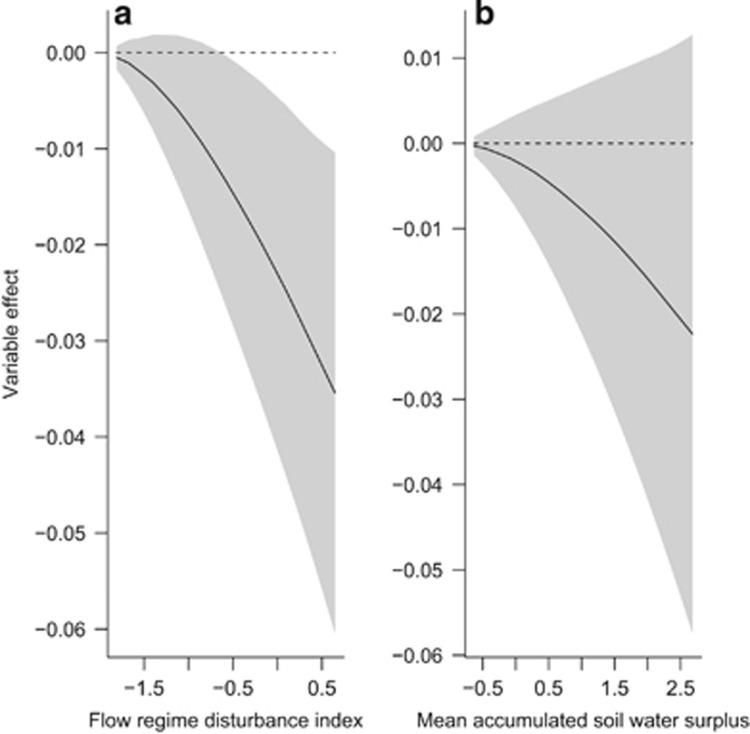
Figure 2.
Bayesian model averaged parameter estimates for variables with probability of inclusion >0.5: (a) flow regime disturbance index and (b) annual mean accumulated soil water surplus. The y axis represents the deviation from the mean HL value (in units of HL) for a given standardised value of the predictor variable. The grey shaded region denotes 1 s.d. either side of the mean fitted effect.

