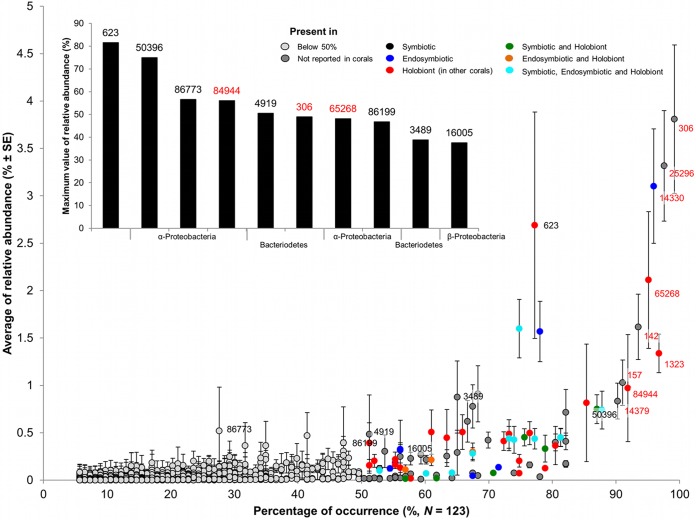
FIG 3 .
Comparison of average relative abundances and percentages of occurrence. Each point represents an operational taxonomic unit (OTU). Point colors indicate microhabitats where these OTUs have been reported previously (NCBI, identities of ≥97%). Labels display OTU numbers; the top nine OTUs with the highest percentages of occurrence are in red. See Table S7 in the supplemental material for complete taxonomic identification. Bar chart shows the top 10 OTUs with the highest maximum values of relative abundance and their taxonomic classification.

