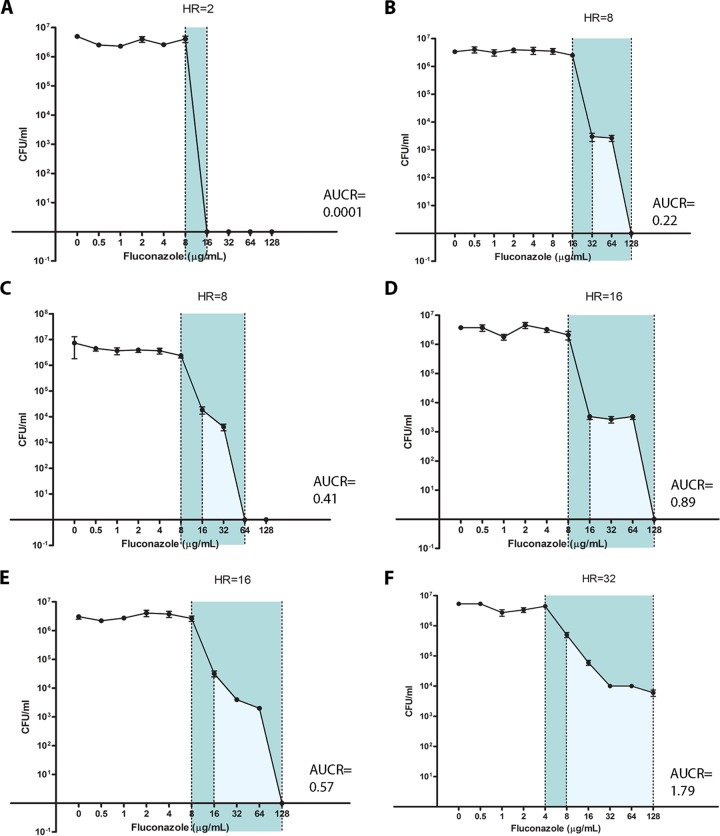
FIG 1 .
Fluconazole population analysis profiles define heteroresistance phenotypes. PAP curves for C. glabrata strains with various degrees of FLCHR are shown (A to F). Population analysis patterns were obtained by fluconazole agar dilution as described in Materials and Methods. The heterogeneity range (HR) is marked in dark blue, and the area under the PAP curve (AUC) is marked in light blue. Note that the AUCRs differ widely between strains that share the same HR values (B and C, D and E). Each data point represents the mean ± the standard error of the mean.

