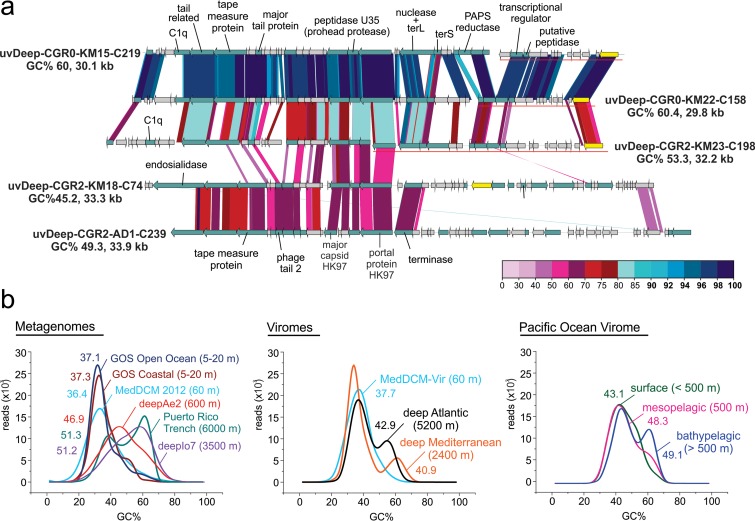
FIG 2 .
(a) Overview of genomic synteny and similarities between complete genomes from group 1. A color scale for percent identity (protein) is shown at the bottom right. The name, percent GC content (GC%), and length for each genome are also indicated. Some gene clusters are shown displaced and underlined in the graphic, indicating that they have been moved to improve comparisons across all genomes. (b) GC plot of metagenomes and viromes from different depths; the mean GC% is also shown for each of the datasets.

