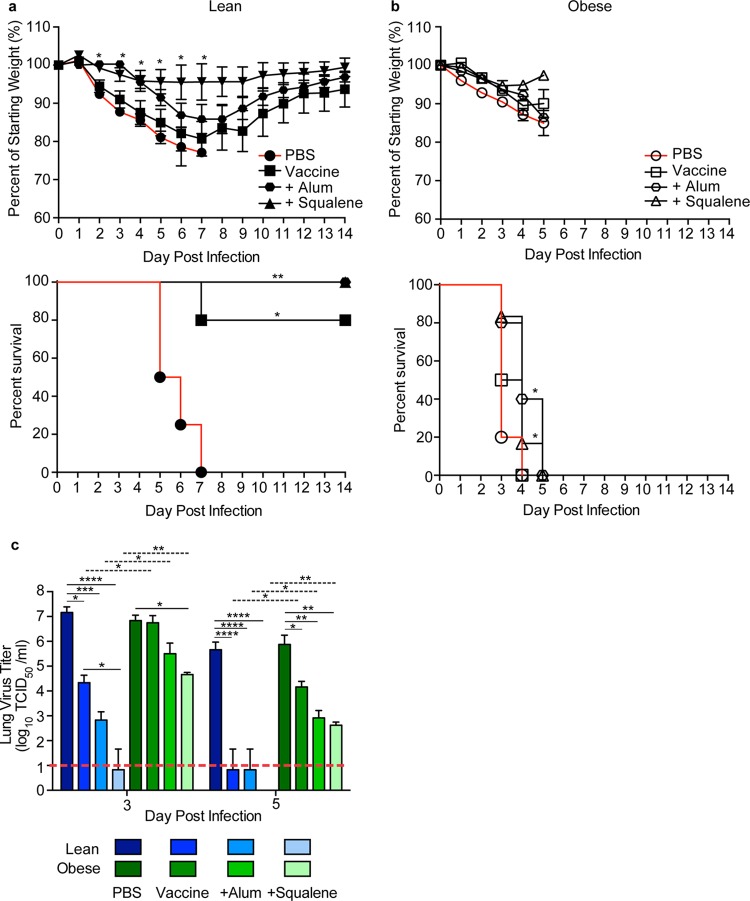
FIG 5 .
Survival, weight loss, and lung viral titers in vaccinated lean and obese mice following H7N9 virus challenge. (a, b) Three weeks postboost, lean (solid symbols) (a) and obese (open symbols) (b) mice (n = 5 or 6/type/group) were challenged with 100× MLD50 of influenza virus A/Anhui/1/2013. The mice were monitored for weight and survival daily for 14 days postinfection. Weight data are presented as mean values ± standard errors. Statistical significance was determined using ANOVA, with a P value of <0.05 deemed significant compared to the PBS controls. Survival data are presented as the percentages of animals surviving among the total number monitored. Statistical significance was determined by log rank (Mantel-Cox) test, with a P value of <0.05 deemed significant compared to the PBS control group. *, P < 0.05; **, P < 0.005. (c) Viral titers were determined in lungs from vaccinated lean (blue) and obese (green) mice at day 3 and day 5 postinfection with influenza virus A/Anhui/1/2013 (H7N9). Data are presented as mean log10 TCID50/ml ± standard error. Statistical significance was determined using ANOVA, with vaccine strategy, mouse type, and day postinfection as the main effects. Tukey’s test was used for post hoc comparison between days postinfection, mouse types, and vaccine strategies. Differences were considered significant at a P value of <0.05. *, P < 0.05; **, P < 0.005; ***, P < 0.0005; ****, P < 0.00005. Solid lines indicate significance within vaccine strategies, and dashed lines indicate significance between lean and obese groups. The dashed red line indicates the limit of detection for the assay.

