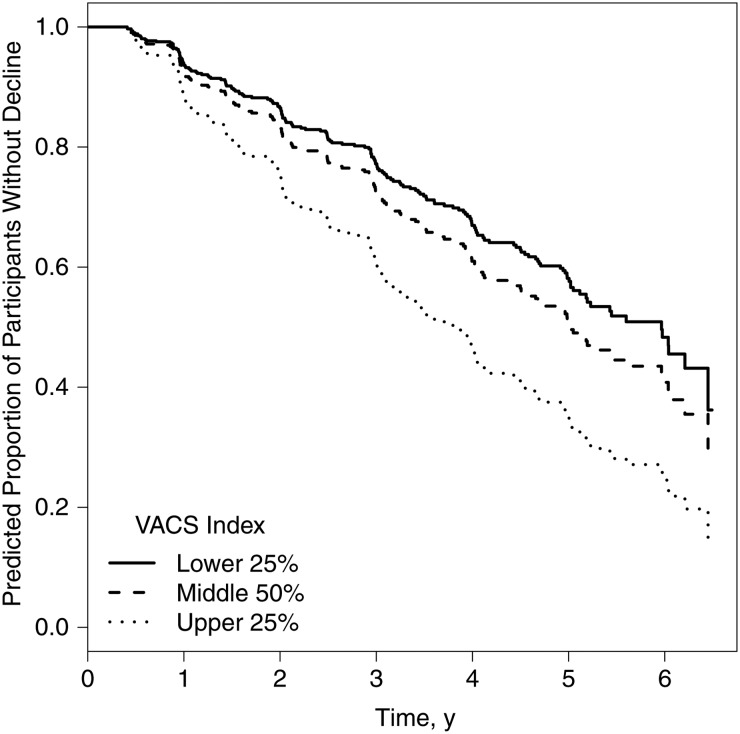
Figure 3.
Overall neurocognitive decline. Graph shows predicted proportion of participants who do not show neurocognitive decline by Veterans Aging Cohort Study (VACS) Index group. Results are based on a time-dependent mixed effects model predicting overall neurocognitive decline (based on regression based norms for change), with adjustment for significant covariates, namely, current major depressive disorder, lifetime other substance use disorder, baseline nadir CD4+ T-cell count, and antiretroviral therapy status (n = 241; VACS Index group pairwise comparisons with false discovery rate adjustment: hazard ratio for high (upper 25%) vs low (lower 25%), 1.93 [95% confidence interval, 1.13–3.29; P < .01]; high vs middle, 1.57 [1.08–2.28; P = .02]; middle vs low, 1.23 [.83–1.83; P = .30]).

