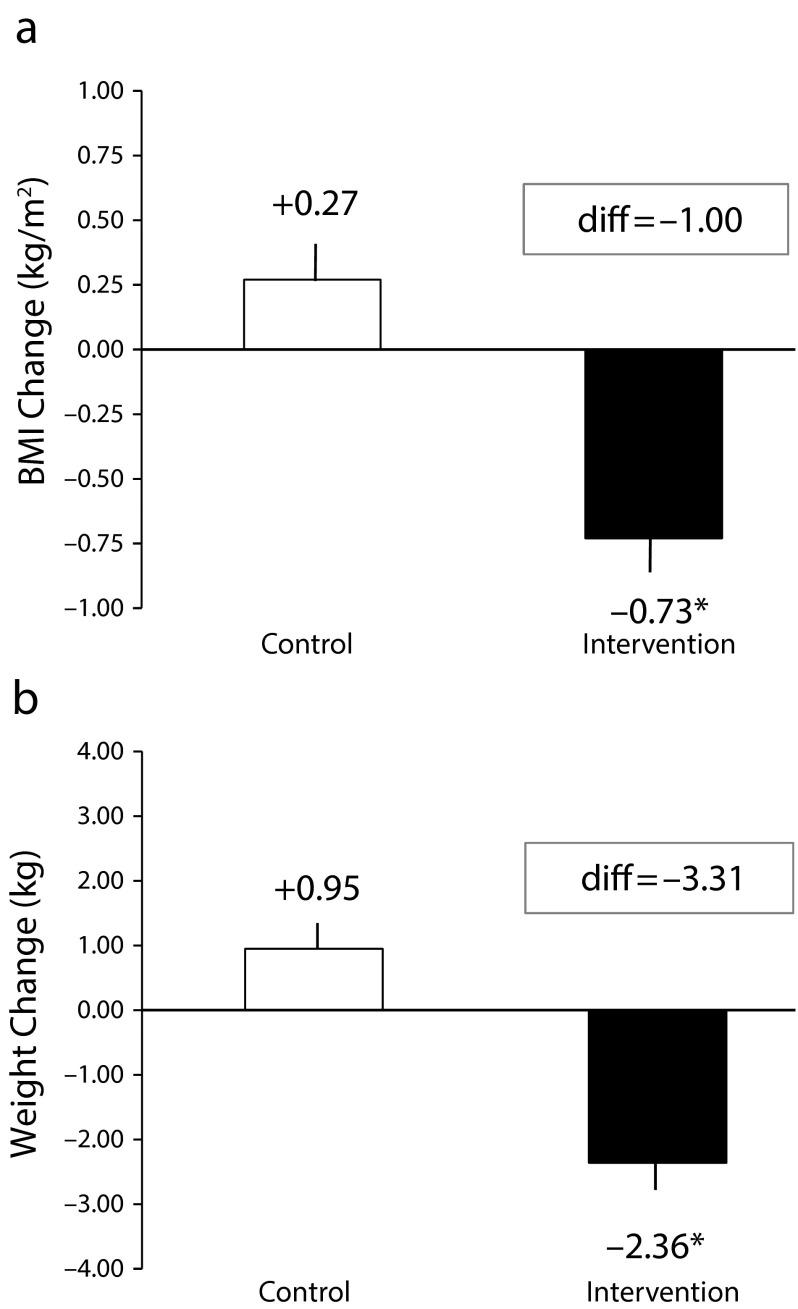
FIGURE 2—
Intervention Effects Over 6 Months in an Intent-to-Treat Analysis Indicated by Adjusted Mean Changes in (a) Body Mass Index (BMI) and (b) Body Weight: Safety and Health Involvement For Truckers (SHIFT) Randomized Controlled Trial, United States, 2012–2014
Note. BMI SE = 0.14 for both intervention and control. Weight SE = 0.38 for control and 0.44 for intervention.
*P < .001.

