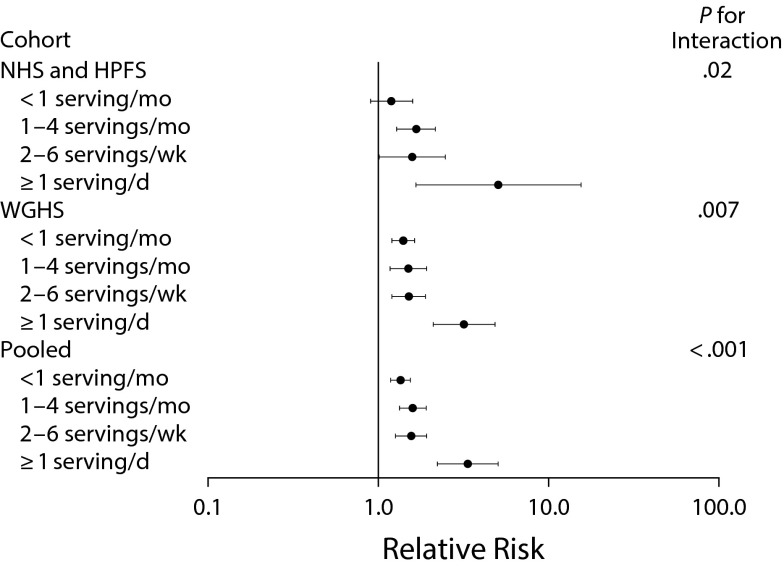
FIGURE 3—
Relative Risk of Developing Obesity Among Nonobese Men and Women, per Increment of 10 Obesity Risk Alleles, According to Intake of Sugar-Sweetened Beverages in the Nurses’ Health Study (1980–1998), Health Professionals Follow-up Study (1986–1998), and Women’s Genome Health Study (1992–1998): United States
Note. Shown are the relative risks of incident obesity, adjusted for age, source of genotyping data, physical activity, time spent watching television, smoking, alcohol intake, and other dietary covariates. Horizontal bars indicate 95% confidence intervals.
Source. Reprinted with permission from Qi et al. 20

