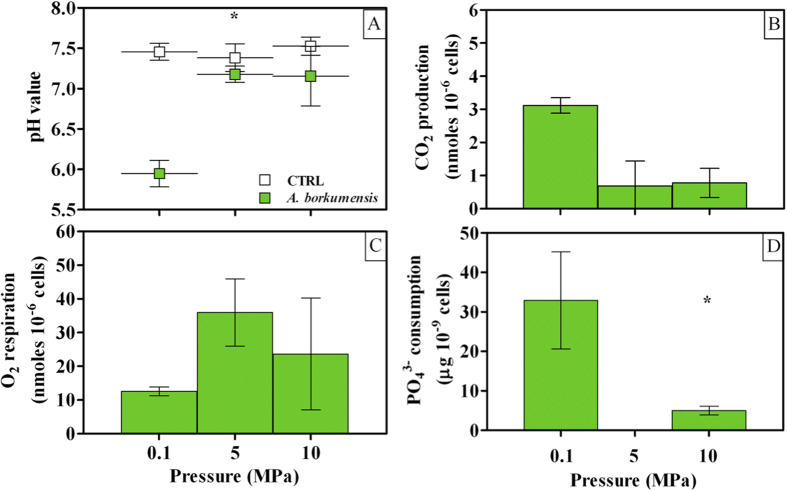
Figure 2. Cell metabolism in A. borkumensis SK2 cells grown under different HPs (0.1, 5 and 10 MPa).
(A) pH decrease with respect to sterile controls (keys reported in the graph); (B) CO2 production per cell; (C) O2 respiration per cell; (D) uptake of PO43−. Bars indicate 95% confidence intervals. Asterisks indicate statistical significance (P < 0.05), that is: in (A), mean average value at 0.1 MPa is lower than at 5 and 10 MPa; (B), mean average value at 0.1 MPa is higher than at 10 MPa.

