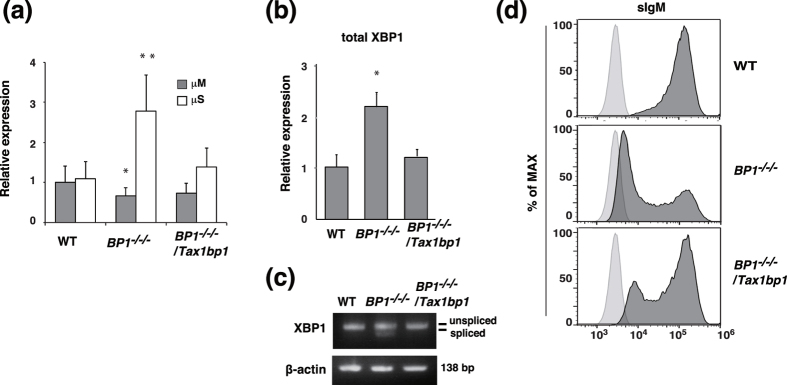
Figure 4. TAX1BP1 deficiency enhances immunoglobulin secretion.
(a) Relative quantification of transcripts for the membrane (μM) and secretory forms (μS) of the immunoglobulin μ heavy chain in WT DT40 (WT), TAX1BP1−/−/− (BP1−/−/−) and TAX1BP1−/−/−/Tax1bp1 (BP1−/−/−/Tax1bp1) clones using quantitative PCR analysis. The transcript levels are shown relative to the transcript level of μM in WT cells, which is set at 1. The results are shown as the means and s.e.m. (n = 4). Statistical analysis was performed by one-way ANOVA (**P < 0.01, *P < 0.05 compared with WT samples). (b) Quantitative PCR analysis of XBP1 in WT, BP1−/−/−, and BP1−/−/−/Tax1bp1 cell lines. The transcript levels are relative to the transcript levels in WT cells, which are set at 1. The results are shown as the means and s.e.m. (n = 4). Statistical analysis was performed by one-way ANOVA (*P < 0.05 compared with WT samples). (c) RT-PCR analysis of XBP-1 splicing in WT, BP1−/−/−, and BP1−/−/−/Tax1bp1 cell lines. The results are representative of 3 independent experiments. (d) Surface immunoglobulin (sIgM) expression in WT, BP1−/−/−, and BP1−/−/−/Tax1bp1 cell lines was analyzed by flow cytometry. Histograms indicate the relative cell number and logarithmic fluorescence intensity.

