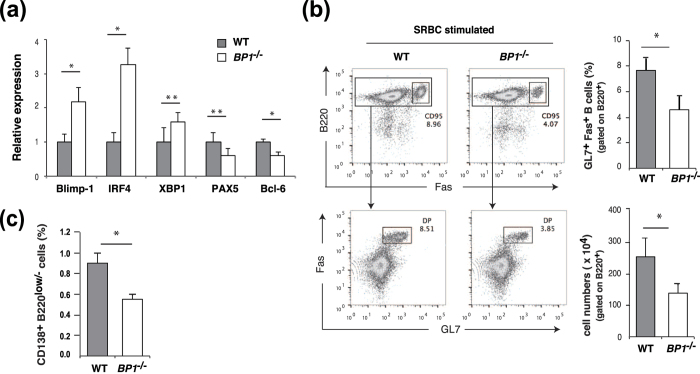
Figure 5. TAX1BP1 deficiency reduced splenic germinal center (GC) B cells in mice.
WT and TAX1BP1-deficient mice were analyzed after secondary immunization with sheep red blood cells (SRBC). (a) Relative quantification of the levels of Blimp-1, IRF4, XBP1, PAX5, and Bcl-6 transcripts in sorted spleen B cells from SRBC-immunized WT and TAX1BP1−/− (BP1−/−) mice. The transcript levels are relative to the transcript levels in splenic B cells from WT mice, which are set at 1. The results are shown as the means and s.e.m. (n = 5). *P < 0.01, **P < 0.05. P values are based on two-tailed Student t tests. (b) Representative flow cytometric plots of splenic GC B cells after secondary immunization with SRBCs; cells were stained for the B cell and GC markers B220 and Fas (top row) or Fas and GL7 (bottom row: gated on B220+ cells). The numbers adjacent to the gated area indicate the percentage of cells in the gate. The percentages and numbers of splenic GC B cells in WT and TAX1BP1−/− (BP1−/−) mice were statistically analyzed. The results are shown as the means and standard deviation (n = 3). *P < 0.05. P values are based on two-tailed Student t tests. (c) The percentage of CD138+ B220low/− cells in WT and TAX1BP1−/− (BP1−/−) mice was statistically analyzed. The results are shown as the means and standard deviation (n = 3). *P < 0.05. P values are based on two-tailed Student’s t tests.

