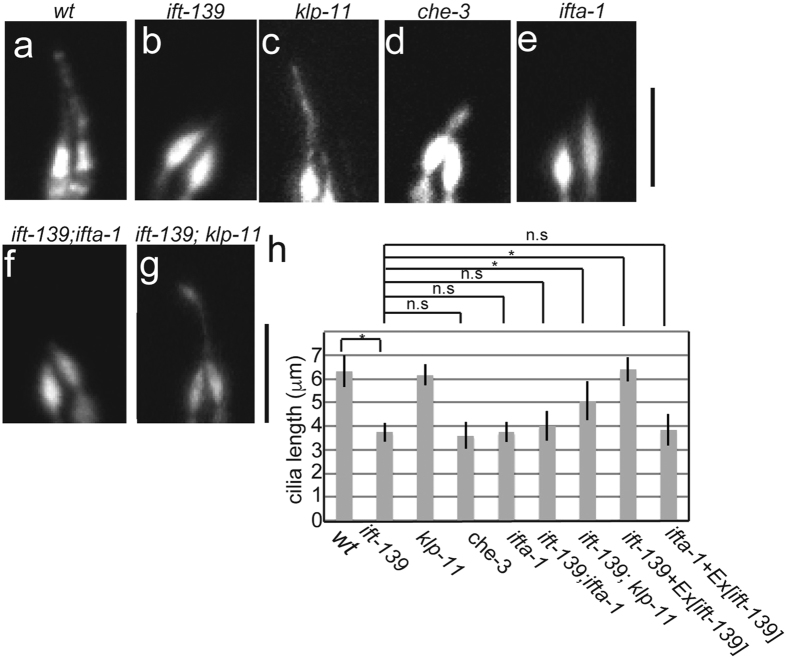
Figure 5. Genetic analysis of ift-139.
Cilia morphology was observed in indicated mutants using the mnIs17 marker. Representative images of wt (a), ift-139 (b), klp-11 (c), che-3 (d), ifta-1 (e), ift-139; ifta-1 (f), ift-139; klp-11 (g). Bars, 5 μm. (h) Cilia length was measured and shown as a bar graph. *p < 0.05, n.s., P > 0.05. One-way analysis of variance. n = 28.

