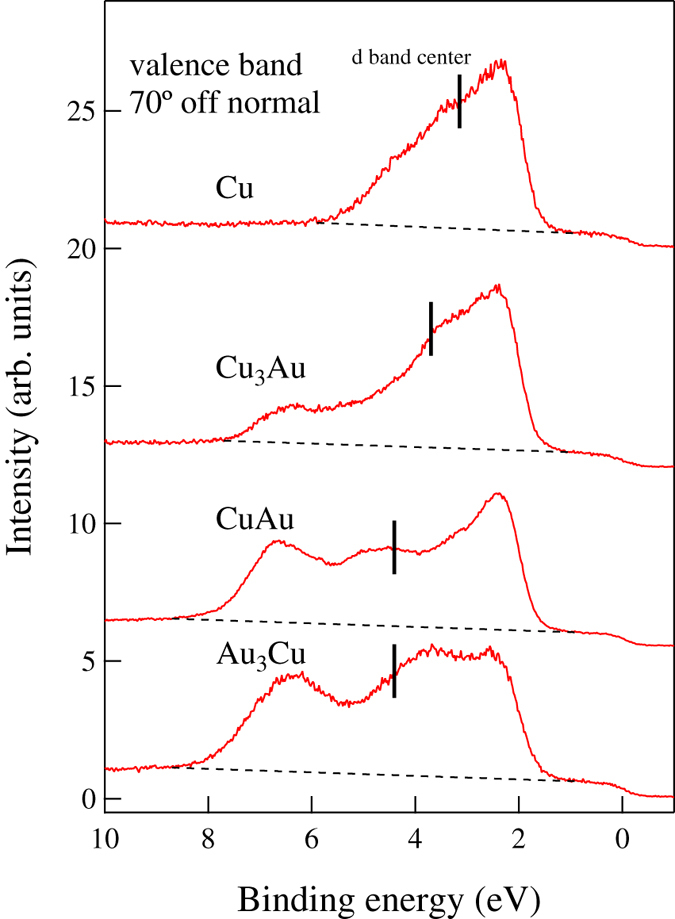
Figure 2. Bulk Au concentration dependence of valence band SR-XPS spectra of clean Cu(111), Cu3Au(111), CuAu(111), and Au3Cu(111).

Red and black lines show the peak curves and the linear fitting (for the sp-band contribution and background, both of which need to be subtracted from the spectra) used in determining the location of the d-band center, respectively. The short vertical lines on each peak indicate the positions of the corresponding d-band centers, viz., Cu: 3.1 eV, Cu3Au: 3.7 eV, CuAu: 4.5 eV, and Au3Cu: 4.4 eV, respectively, for detection 70° from the surface normal. For detection along the surface normal, the d-band center are located as follows: Cu: 3.2 eV, Cu3Au: 3.6 eV, CuAu: 4.4 eV, and Au3Cu: 4.5 eV.
