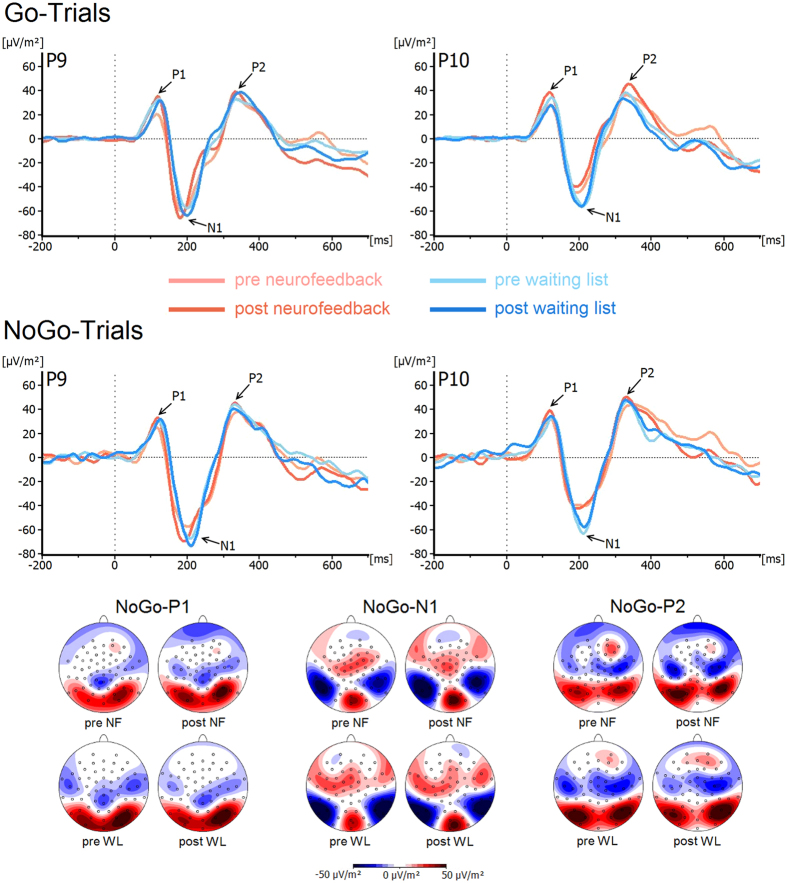
Figure 1. Stimulus-locked waveforms (current source density) and topographic maps for P1, N1 and P2 components, depicted for Go and Nogo trials, both experimental groups (NF = neurofeedback, WL = waiting list controls) and both time points at electrodes P9 and P10.
Point 0 denotes Go/Nogo stimulus onset. In the Nogo-topographic maps blue denotes negative deflections whereas red reflects positive ones.

