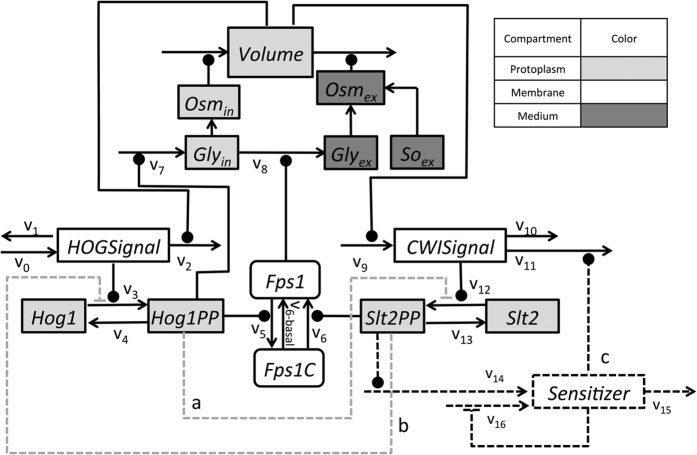
Figure 2. Alternative model structures.
Dashed lines indicate alternative components defining different model candidates. The best ranked model included the dark dashed lines. Three different sources of variation were implemented, each of them could adopt two different setups, and consequently 8 different model combinations were achievable: (a) Activated Hog1 inhibits the Slt2 activation/phosphorylation (reaction v12), (b) Activated Slt2 inhibits the Hog1 activation/phosphorylation through (reaction v3) and (c) a Slt2PP-dependent Sensitizer decreases CWISignal (v11). We primarily started with four models and included the 3rd source of variation “c” later on, as explained in the text. Gly, Osm, and So represent Glycerol, Osmotic pressure, and Sorbitol, respectively.

