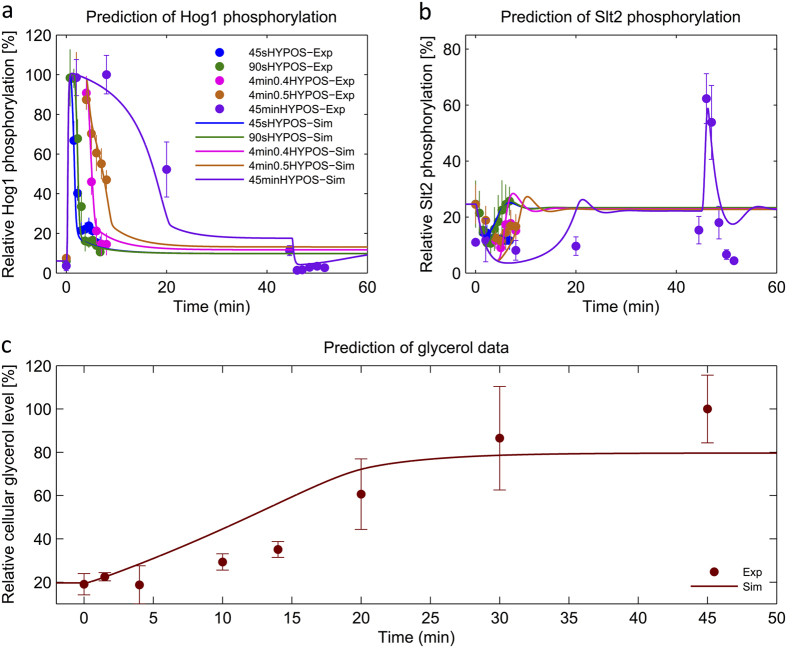
Figure 4. Reproduction of experimental data dedicated for prediction using model with sensitized negative feedback.
Relative Hog1 and Slt2 phosphorylation data and relative value of cellular glycerol measurements, used for prediction, are plotted versus time. Simulations were done using the best ranked model from the ensemble of models with sensitized negative feedback. Solid lines show model simulations and filled circles (•) show the experimental data (Mean ± SD (n = 3)). (a) Comparison between Hog1 phosphorylation data and its simulation for 0.8 M sorbitol shock with subsequent dilution to 0.27 M sorbitol at 45″, 90″ and 45′ (45SecHYPO-Exp, 90SecHYPO-Exp, 45 minHYPO-Exp) and 0.8 M sorbitol shock with subsequent dilution to 0.5 and 0.4 M sorbitol at 4′ (4 min0.5HYPO-Exp, 4 min0.4HYPO-Ex) using the best ranked model. (b) Comparison between Slt2 phosphorylation data and its simulation for 0.8 M sorbitol shock with subsequent dilution to 0.27 M sorbitol at 45″, 90″ and 45′ and 0.8 M sorbitol shock with subsequent dilution to 0.5 and 0.4 M sorbitol at 4′ using the best ranked model. (c) Comparison between the relative value of intracellular glycerol content for 0.8 M sorbitol shock and its simulation. We used same color code for panel a,b.

