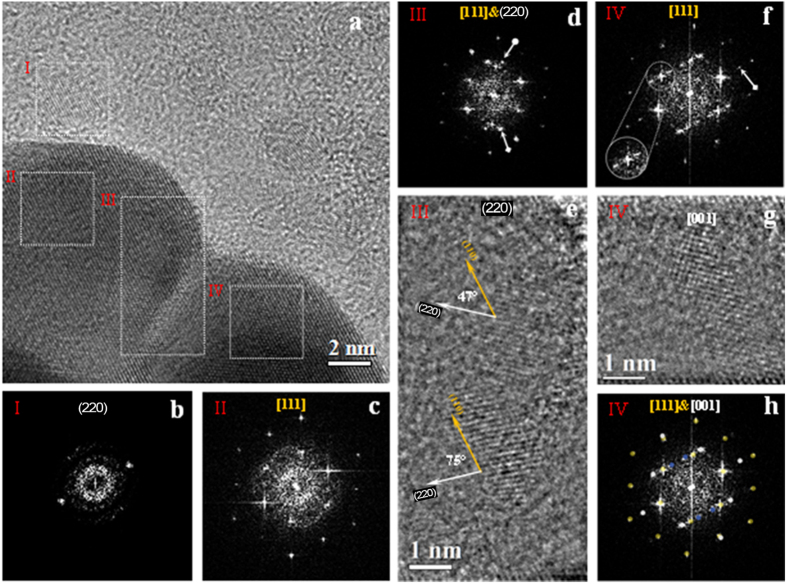
Figure 4. Evidence of Au-ND nanocrystals from High resolution TEM.
(a) Bright field HRTEM image of Au-NDs edge. (b) FFT pattern of region I shows the (220) plane of one ND. (c) FFT pattern of region II shows Au atomic layers oriented along [111] axis. (d) FFT pattern of region III shows Au hexagonal array and twosome internal symmetric reflections belongs to the ND (220) plane. (e) IFFT image of (Fig. 4d) without Au contribution. (f) FFT pattern of region IV. (g) Identification of the FFT diffraction spots of (Fig. 4f) by electron diffraction simulation. The Au cubic phase orientated along [111] zone axis is marked by yellow spots, the silver spots corresponds to the ND cubic phase orientated along [001] zone axis, and gold defect are marked by blues spots. (h) IFFT image of (Fig. 4f) without gold contribution.

