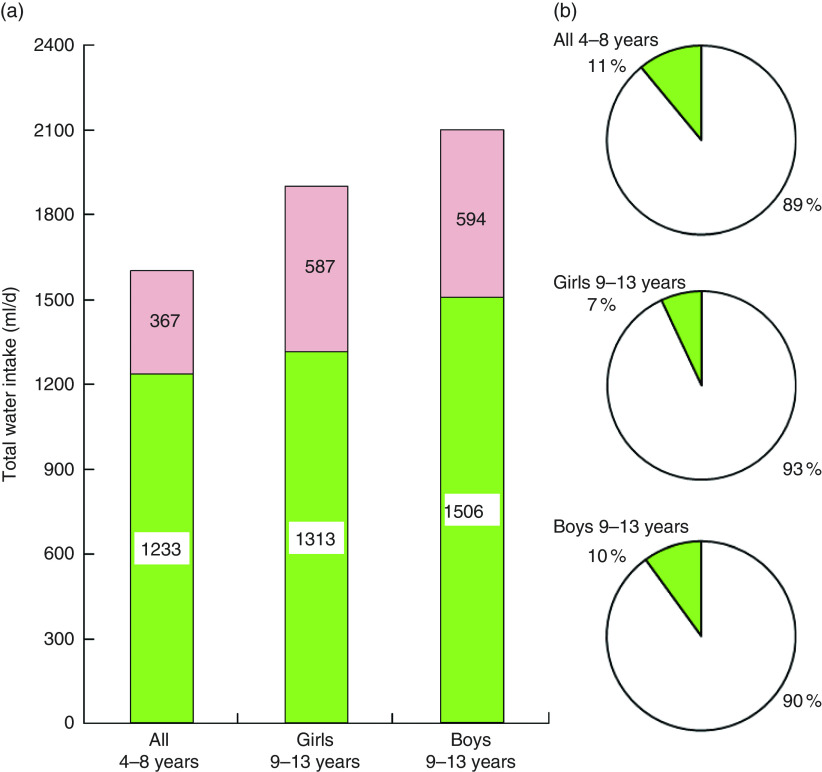
Fig. 2.
(colour online) (a) Total water intake (ml/d) by age group and sex ( ) in relation to the European Food Safety Authority (EFSA) recommendations; the amount of water shortage is also indicated (
 ). (b) The proportion of children (%) by age group and sex who did (
 ) or did not (
 ) meet EFSA recommendations. French children aged 4–13 years (n 835), INCA 2 (Étude Individuelle Nationale des Consommations Alimentaires 2006–2007)

