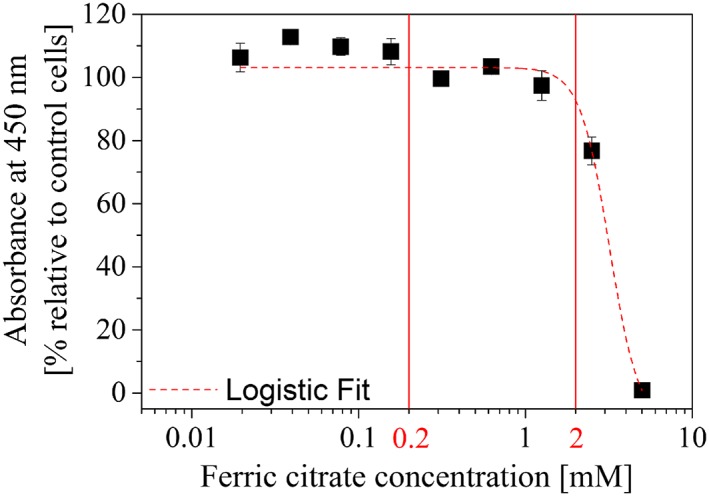
Figure 3.

The viability of CHO‐K1 cells after exposure to ferric citrate. Cells were exposed to FC for 24 h and the viability was quantified using a colorimetric assay based on the water‐soluble tetrazolium salt WST‐8. Viability is expressed as the absorbance at 450 nm in relation to control (untreated) cells. Error bars represent the SD from three measurements and the concentrations used as a supplementation for iron loading are shown in red. A maximum supplementation of 2 mM FC, where viability was above 90%, was chosen for all experiments.
