
Figure 5.
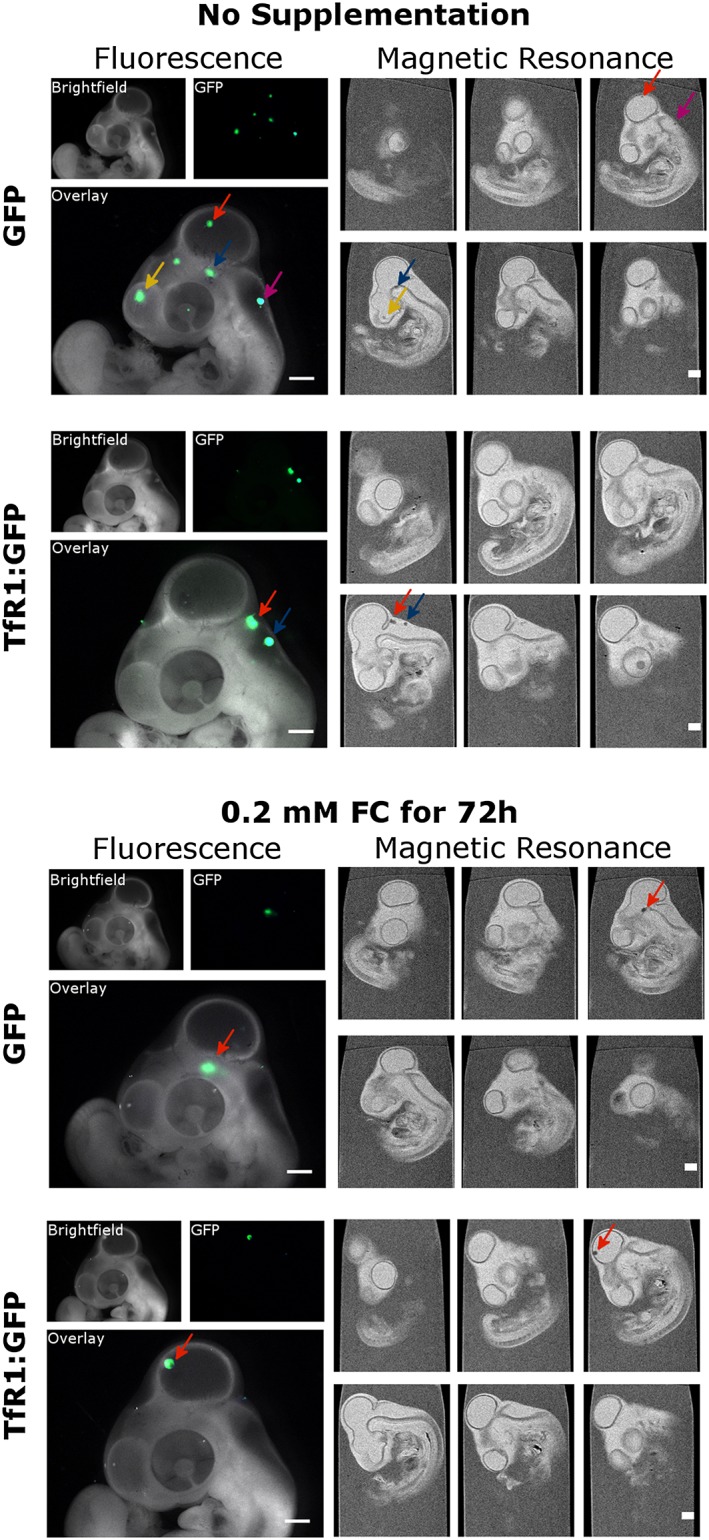
Fluorescence and MR imaging of cells implanted into the brain of a chick embryo. Cells (2 × 10⁵) expressing GFP or TfR1:GFP were implanted into the midbrain of chick embryos at E3. At E5 the embryos were harvested from their eggs, imaged with a fluorescence stereomicroscope and fixed prior to MRI using a T 2‐weighted RARE sequence. Clusters of cells expressing GFP were found in different regions of brain via fluorescence microscopy and are indicated with arrows. These clusters could then be identified as hypointense regions in the MR images. Six sagittal slices through the chick are shown in the right‐hand panel. Scale bars represent 1 mm.