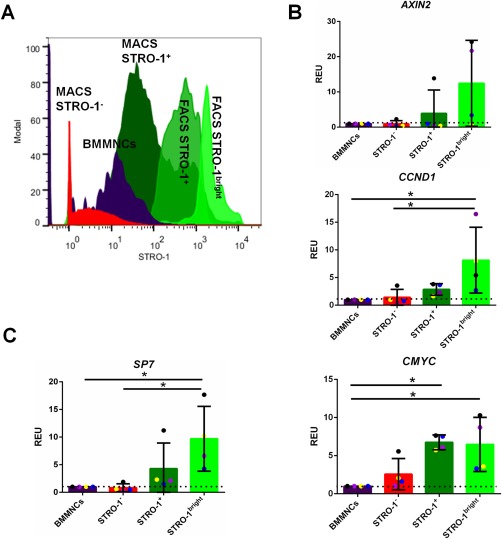
Figure 3.

STRO‐1+ population within the bone marrow has intrinsically higher Wnt signaling than the general bone marrow population. (A): Fluorescence‐activated cell sorting (FACS) histogram depicting gating for FACS STRO‐1‐sorted samples. The STRO‐1bright cells are the top 10% fraction of the FACS STRO‐1+ cells. (B): Qualitative polymerase chain reaction (qPCR) data showing Wnt signaling pathway target genes mRNA expression (AXIN2, CCND1 and CMYC, respectively) in FACS‐sorted samples (STRO‐1−, STRO‐1+, and STRO‐1bright cells as relative to bone marrow mononuclear cells [BMMNCs]), based on the level of STRO‐1+ mesenchymal stem cell [MSC] marker expression. All data have been normalized to βACTIN and to 1 for BMMNCs of the same marrow sample. n = 4; *, p < 0.05. (C): qPCR data showing SP7 mRNA expression in FACS‐sorted samples (STRO‐1−, STRO‐1+, and STRO‐1bright cells as relative to BMMNCs), based on the level of STRO‐1+ MSC marker expression. All data have been normalized to βACTIN and to 1 for BMMNCs of the same marrow sample. n = 4; *, p < 0.05. Abbreviations: BMMNCs, bone marrow mononuclear cells; FACS, fluorescence‐activated cell sorting; MACS, magnetic activated cell sorting; REU, relative expression units.
