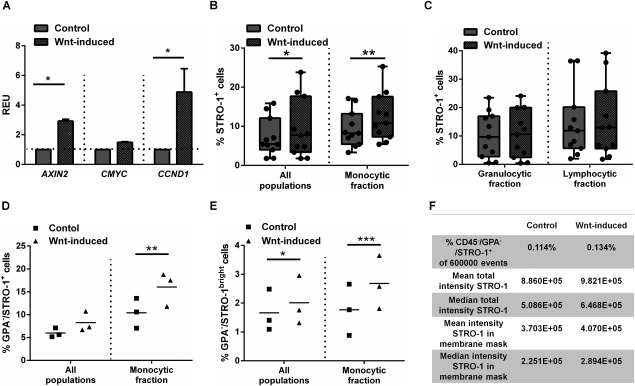
Figure 4.

Wnt3A stimulation activates Wnt signaling pathway activity in stromal populations and promotes their expansion. (A): Wnt target gene expression after 24 hours of suspension culture in the STRO‐1‐selected cells. n = 3, statistical significance *, p < 0.05. (B): STRO‐1 marker expression is augmented within the entire bone marrow and gate co‐localizing with monocytes. (n = 11; *, p < 0.05; **, p < 0.01) or (C) unchanged within specific gates co‐localizing with lymphocytes and granulocytes (n = 11, ns). The proportion of Glycophorin A (GPA) −/STRO‐1+ cells (D) or GPA−/STRO‐1bright cells (E) is increased following Wnt stimulation in the “monocyte” gate (n = 3; *, p < 0.05; **, p < 0.01; ***, p < 0.001. (F): Image Stream analysis demonstrates an increase in cell intensity for the STRO‐1 antigen staining following Wnt‐induction in CD45−/GPA−/STRO‐1+ population. Abbreviations: GPA, Glycophorin A; REU, relative expression units.
