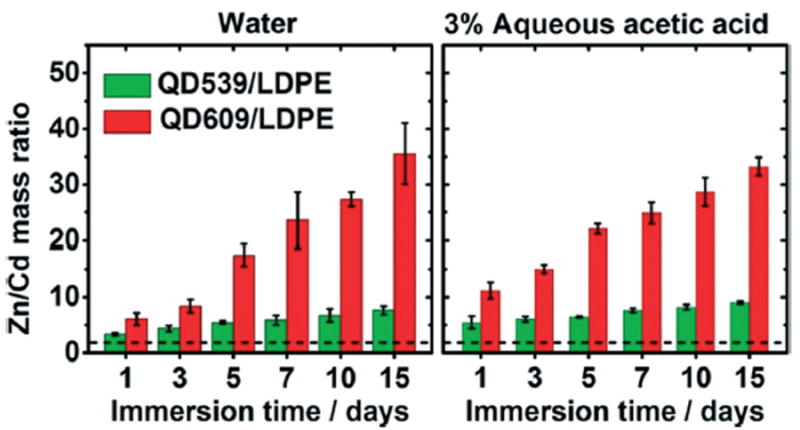
Fig. 4.

The mass ratio of released zinc to cadmium from QD539/LDPE (green) and QD609/LDPE (red) into water (left panel) and 3% (v/v) aqueous acetic acid (right panel) held at 75 °C, as a function of immersion time. The approximate location of the Zn/Cd mass ratio of neat QDs (2.161 ± 0.041 and 2.187 ± 0.007 for QD539 and QD609, respectively) is shown as a dashed black line. Each reported value is the average of measurements from four independent samples. Error bars represent standard deviations.
