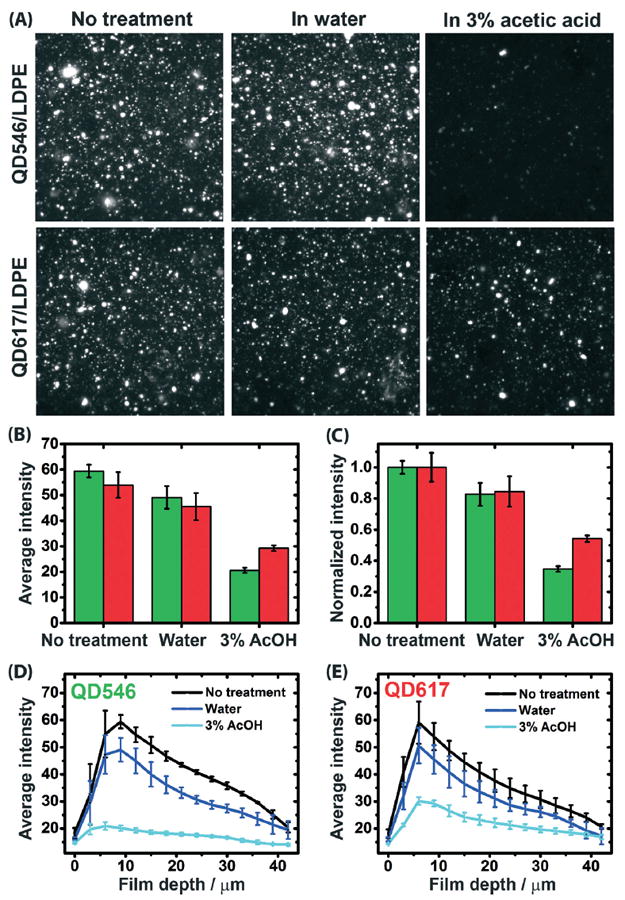
Fig. 5.

Panel (A) shows comparative LSCM images of QD546/LDPE (top row) and QD617/LDPE (bottom row) after no immersion treatment (left column) and after immersion in water (middle column) or 3% aqueous acetic acid (right column) at 75 °C for 17 days. The images correspond to a focal plane depth of approximately 9 μm below the film surface and have lateral dimensions of 56 μm × 56 μm. Panels (B) and (C), respectively, plot average and normalized (to the “no treatment” condition) photoluminescence intensity for experiments depicted in the LSCM images. Panels (D) and (E) plot the average photoluminescence intensity values for the various treatment types, broken down by focal plane depth, for QD546/LDPE and QD617/LDPE materials, respectively. The neat LDPE control (not shown) exhibits no luminescent intensity either before or after immersion treatments. The error bars represent standard deviations, based on n = 3. Note that the drop off in PL intensity at progressively lower penetration depths is due to the less efficient light capture efficiency of the microscope, so only comparisons between treatment types at specific penetration depths are meaningful. The excitation wavelength was 405 nm in all experiments.
