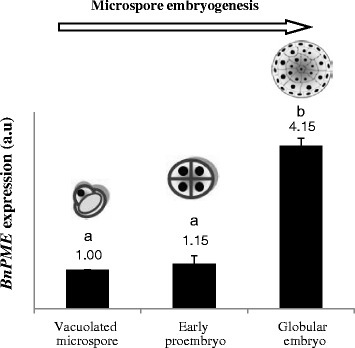
Fig. 3.

Expression analysis of BnPME gene by quantitative RT-PCR during stress-induced microspore embryogenesis. Histogram expresses relative changes of expression at different developmental stages: vacuolated microspore (starting point, before reprogramming induction), early proembryo, and globular embryo. Each column represents the mean of two independent reactions with three replicates of each reaction. Transcript levels were normalized to vacuolated microspore levels. Bars indicate the SEM. Different letters on columns indicate significant differences at P < 0.05
