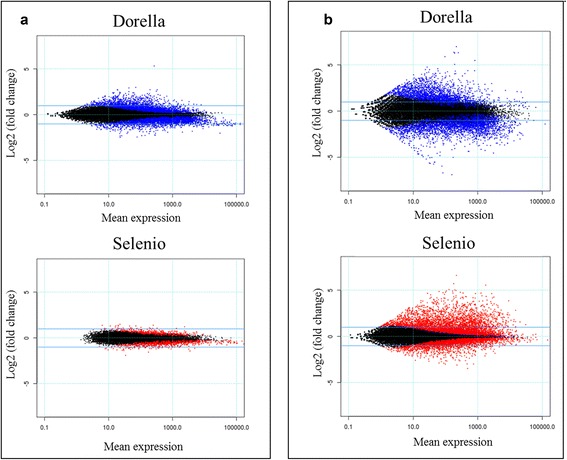
Fig. 4.

Mean expression versus log fold change plots (MA-plots). Transcriptional changes are presented in Selenio and Dorella at 1 week post germination (a) and 3 weeks post germination (b). Normalized mean expression values are plotted versus log2 fold changes. Genes with an FDR < 0.05 are plotted in blue for Dorella and red for Selenio
