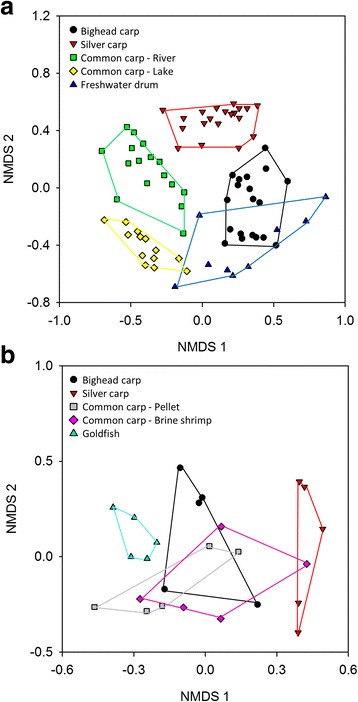
Fig. 5.

Ordination of fecal microbiomes of a wild and b laboratory fish. Non-metric multidimensional scaling was used, and distance was based on Bray-Curtis dissimilarity. The R 2 for plots of wild and laboratory fish communities was 0.67 and 0.77, respectively. Convex hulls connect individuals from the same group
