
Fig. 6.
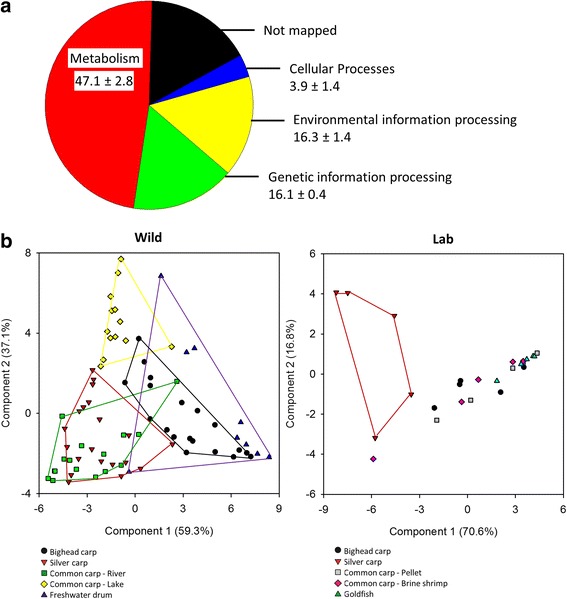
PICRUSt classification of KEGG Orthologies (KO). a Tier 1 KO functions across all groups for functions greater than 1 % of total gene counts for each KO. Average and standard deviation across species are shown below labels. b Principal components analysis of Tier 2 KO functions for wild and lab fish groups. Convex hulls connect individuals from the same group, but they are not shown for some lab fish due to overlapping distribution