Fig. 6.

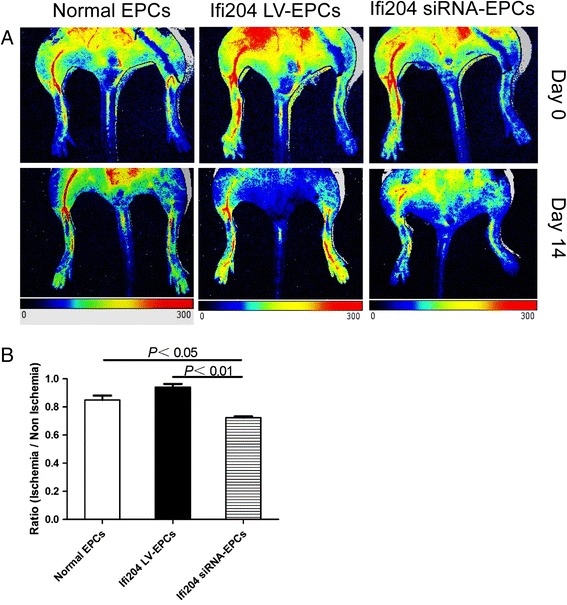
Blood flow patterns in ischemic hindlimbs. a LDPI was used to analyze blood flow 14 days after ischemia. Top panel: representative features just after surgery. Colors displayed correspond to intervals of perfusion value from 0 (dark) to 300 (red). Red, highest velocity; green, intermediate; blue, low; and dark, lowest velocity. b Blood-flow ratio of ischemic-to-contralateral hindlimb after 14 days (n = 6). P < 0.05, normal EPCs vs Ifi204 siRNA-EPCs; P < 0.01, Ifi204 LV-EPCs vs Ifi204 siRNA EPCs. EPC endothelial progenitor cell (Color figure online)
