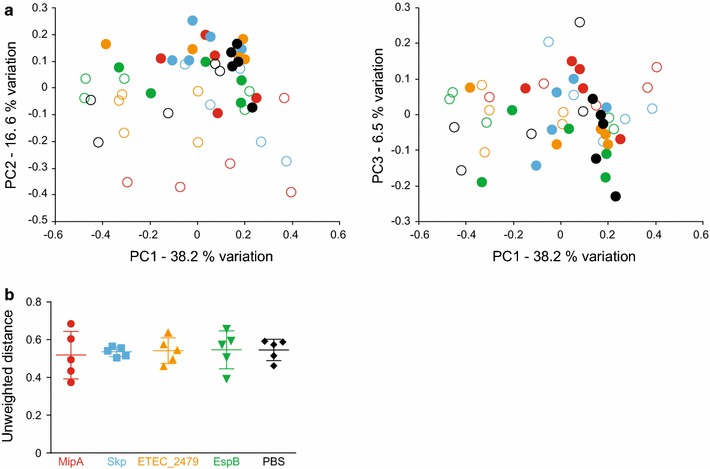
Fig. 3.

Principal component analyses and UniFrac distances. a Unweighted principal component analyses showing β-diversity of fecal microbiota in mice pre- and post-vaccination with the indicated antigens, as detected via 16S rRNA amplicon sequencing. Principal component 1 (PC1) versus PC2 (left) and PC1 versus PC3 (right) are shown. Color-coding is identical to Fig. 2, with open symbols representing pre-vaccination and closed symbols representing post-vaccination samples. b Mean intragroup unweighted UniFrac distances between pre- and post-vaccination samples
