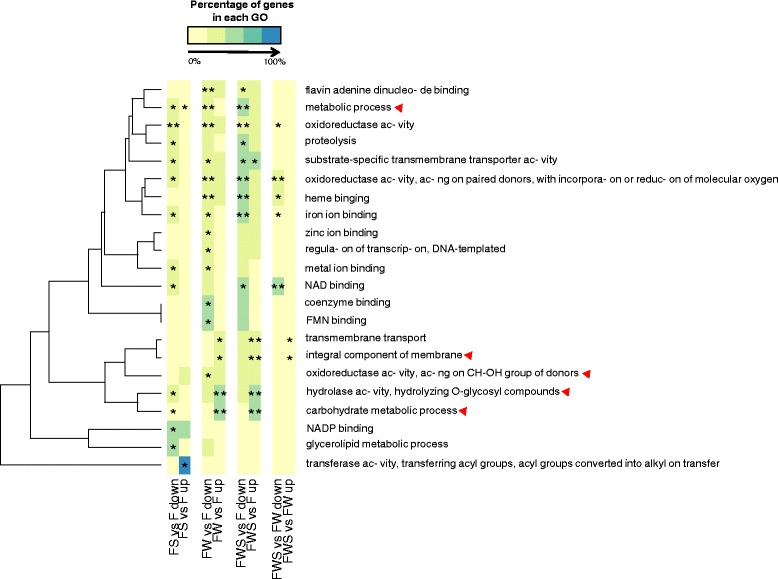
Fig. 5.

Functional enrichment of Gene Ontology (GO) categories based on the differentially expressed genes in each analyzed contrast. The color key indicate from pale yellow to blue, the increasing percentage of genes representing each functional category. To eliminate general and excessively specific categories, only the functional categories that have at least 5 and maximum 500 genes were considered in the analysis. The contrasting conditions evaluated are those indicated in Fig. 1. Briefly, FS/F: effect of heat stress (HS); FWS/FW: effect of HS but in the presence of grapevine wood; FWS/F: effect of HS in the presence of grapevine wood and FW/F: effect of only GW. * FDR < 0.2 and ** FDR < 0.05
