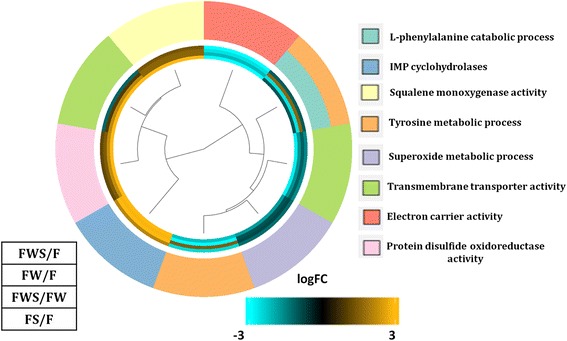
Fig. 6.

Gene Ontology (GO) of biological process categories with enrichment and showing differentially expressed genes in all the contrasting conditions evaluated (FDR < 0.05). The color key indicates logFC values ranging from golden for up-regulated genes, to cyan for down-regulated genes. The dendrogram indicates the relationship through the hierarchical clustering of gene expression (the middle rings show from the center out: effect on L. theobromae gene expression of heat stress (HS) and grapevine wood (FWS/F), only grapevine wood (FW/F), only HS (FS/F), and effect of HS in the presence of grapevine wood (FWS/FW). The Biological Process GOterms are indicated in different colors on the outermost circle
