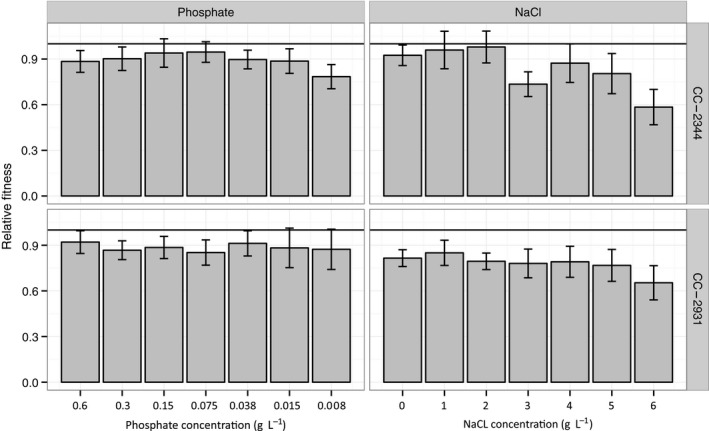
Figure 2.

Mean relative fitness of mutation accumulation line genotypes derived from two ancestral strains under decreasing phosphate 400% (0.6 g L−1), 200% (0.3 g L−1), 100% (0.15 g L−1), 50% (0.075 g L−1), 25% (0.038 g L−1), 10% (0.015 g L−1), and 5% (0.0075 g L−1) KH 2 PO 4; and increasing NaCl (0–6 g L−1 of NaCl in 1 g L−1 increments) conditions, ordered by increase in stress level. Error bars indicate 95% confidence intervals.
