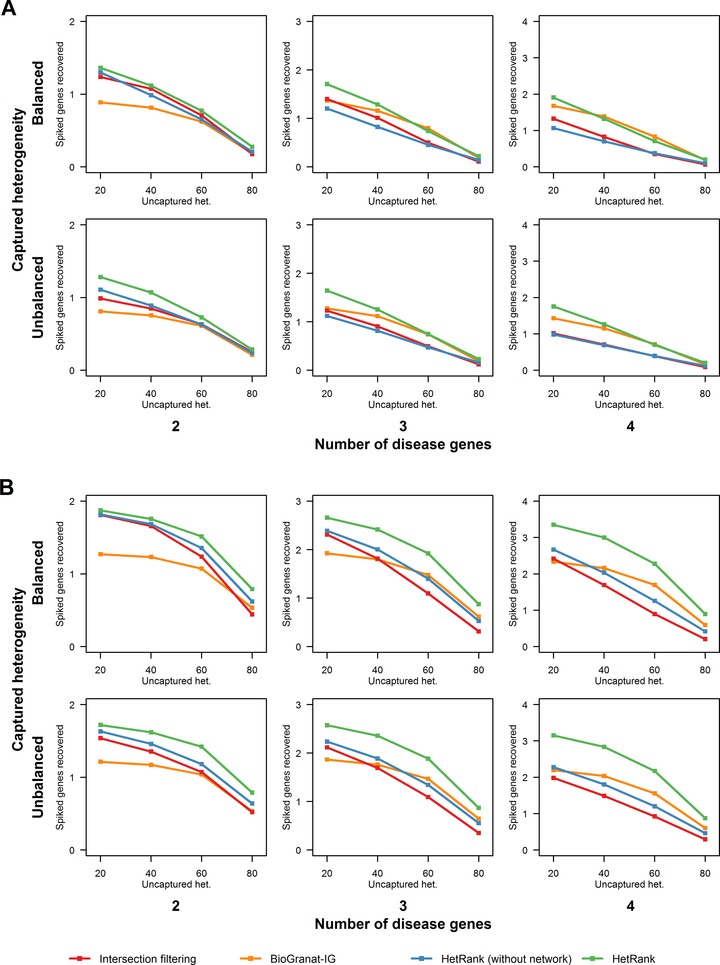
Figure 2.

Performance of our approach at varying levels of genetic heterogeneity. Plots show the average number of spiked disease genes that could be prioritized (assigned a rank of 10 or less) across 1,000 simulated exome sequencing studies by the four methods tested (HetRank, HetRank excluding the network‐based step, BioGranat‐IG and simple intersection filtering). Different genetic heterogeneity scenarios are represented by the columns (number of genes in disease subnetworks modeling genetic heterogeneity), rows (whether this captured heterogeneity is balanced or unbalanced across disease subnetwork genes), and plot x‐axes (degree of genetic heterogeneity not captured by disease subnetwork genes). Results are also tabulated in Supp. Table S4. (a) Autosomal dominant mode results. (b) Autosomal recessive mode results.
