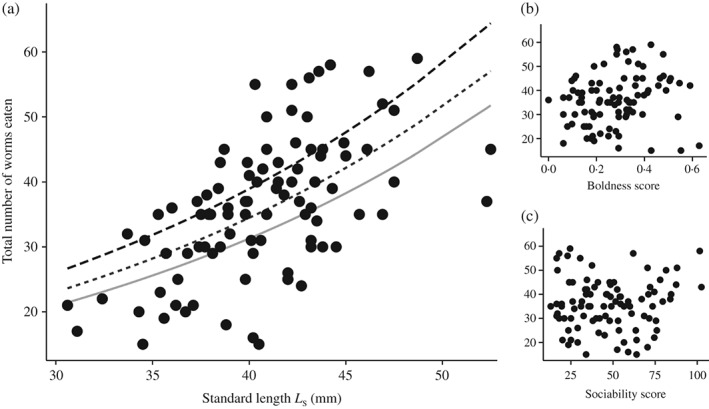
Figure 1.

Scatterplots showing the relationship between (a) standard length (L
S), (b) boldness (the average proportion of time out of cover during the risk‐taking test) and (c) sociability (the average distance from the compartment housing conspecifics in the sociability test) and the total number of Chironomus sp. eaten (n = 94). Lines in plot (a) are predicted maximum food intake for the shyest ( ), intermediate (
 ) and boldest individuals (
 ).
).
