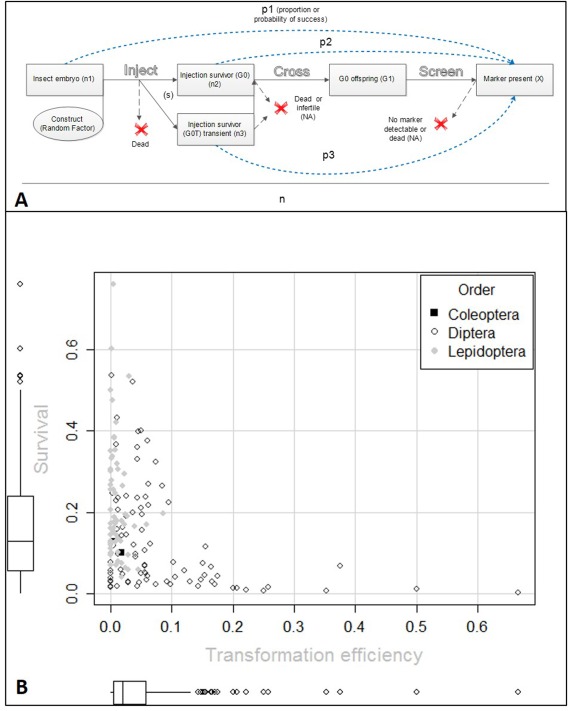
Figure 3.

(A) The experimental unit set‐up of variables and statistics of interest after a given construct was injected into an embryo n1 times, with probability of survival s. Values not observed or recorded are annotated with ‘NA’ (not available). The outcome of each trial, n, is assumed to be independent from the outcome of all other trials. After injection the embryo has p1 probability of producing transgenic offspring. The embryo will either die, or develop into a transient (G0T) (injection survivors showing transient expression of the fluorescent marker) or nontransient fertile adult (G0) (injection survivor not showing transient expression of the fluorescent marker or a transient adult that was not detected as transient). Considering the G0 survivors, n2 – a proportion, p2, will produce at least one transgenic offspring (known as ‘transformation efficiency’ in Warren et al., 2010 and Martins et al., 2012) This particular transformation efficiency (X/G0 and X/n2) leads to a lower calculated rate than if only fertile G0 individuals were considered; as we have no estimate of the infertility or fertility rate in G0; this could not be corrected for. Multiple transgenic G1 from the same G0 parent pool are assumed to represent a single transformation event unless shown otherwise with molecular tests. Of the G0T, n3 ‐ a proportion, p3 will produce transgenic offspring. The proportions p1–p3 are bounded between zero and one and are derived from how many times an event, transgenesis (X), did or did not occur (the numerator). The phrases transgenic efficiency and transgenic rate are used interchangeably for p2 (p1 is not given a name despite recommendations from Warren et al., 2010). (B) The correlation between microinjection survival and the achieved transformation efficiency is described. Each point represents an evaluation unit, the number of successes of a unique construct injected into a species of preblastoderm embryo, divided by the number of trials. The survival axis corresponds to number of injection survivors (to adulthood) divided by the number of embryos injected. The transformation efficiency is derived from the number of injection survivors divided by the number of independent transgenic lines generated. The figure does not group the data into species hence the more uniform and poly‐modal shape along the survival axis. A box‐and‐whisker plot on each axis describes the density of the data.
