
Figure 4.
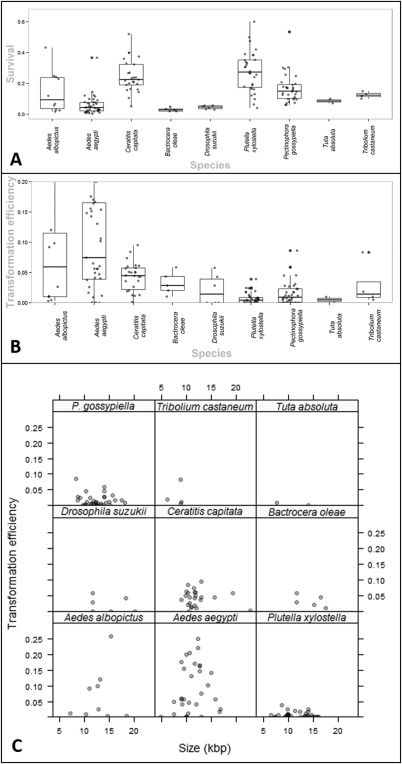
(A) The proportional survival of Oxitec insect research species, from embryo to fertile adult, following microinjection of a piggyBac vector. A horizontal jittered scatterplot is overlaid on a boxplot, summarizing the survival distribution for each species. Species are grouped by insect order (Diptera, Lepidoptera and Coleoptera) from left to right. The asterisks show the points that were outliers. For each species there are 10 Aedes albopictus, 39 Aedes aegypti, 26 Ceratitis capitata, five Bactrocera oleae, four Drosophila suzukii, 29 Plutella xylostella, 32 Pectinophora gossypiella, two Tuta absoluta and two Tribolium castaneum data, each representing a unique construct experiment. One outlier at 0.67 survival was removed from Pl. xylostella to improve ease of reading. (B). The transformation efficiency of different genetic constructs vectored by piggyBac into the germline of different insect species. Transformation efficiency is defined as the number of independent transgenic lines divided by the number of fertile injection survivors crossed, given the unique construct species combination. Few data were found above 0.2 transformation efficiency so the y ‐axis was limited to this range. For each species there are 10 Aedes albopictus, 39 Aedes aegypti, 26 Ceratitis capitata, 5 Bactrocera oleae, four Drosophila suzukii, 31 Plutella xylostella, 35 Pectinophora gossypiella, two Tuta absoluta and two Tribolium castaneum data. (C) A lattice plot of the transformation efficiency of constructs injected into different species by size (in bp). Most constructs are 10 000–15 000 bp in length. As these are injected more frequently there is a cluster of points around this range for each species. Small (< 10 kbp) or large (> 15 kbp) are injected more rarely and so data for these are sparse. The data are subsetted into a species pane with the species label above. Each datum is transparent; dark points represent overlap.