
Figure 4.
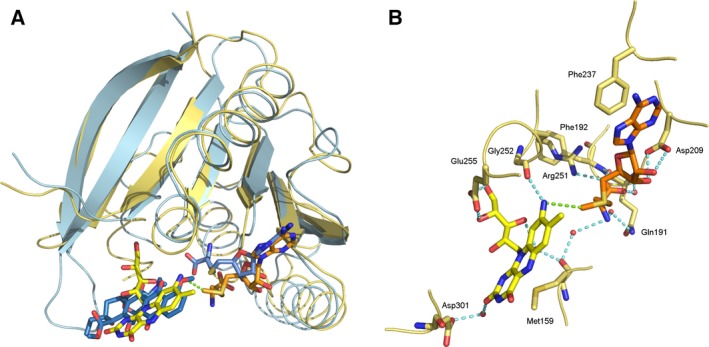
Structure of the putative active site of RosA. (A) Close‐up view of the superimposed structures of RosA (shown in yellow) and carminomycin‐4‐O‐methyltransferase (PDB ID 1TW2; shown in blue). Ligands of 1TW2 (S‐adenosylhomocysteine and 4‐methoxy‐E‐rhodomycin) are shown as blue sticks. AF and SAM are shown in their predicted binding modes as yellow and orange sticks, respectively. (B) Close‐up view of the predicted binding pocket of RosA. Potential hydrogen bonding with AF (shown in yellow) and SAM (shown in orange) is indicated by blue dashed lines. Water molecules are represented as red spheres. The distance between the reactive methyl group of SAM and the amino group of AF is indicated by a green dashed line.