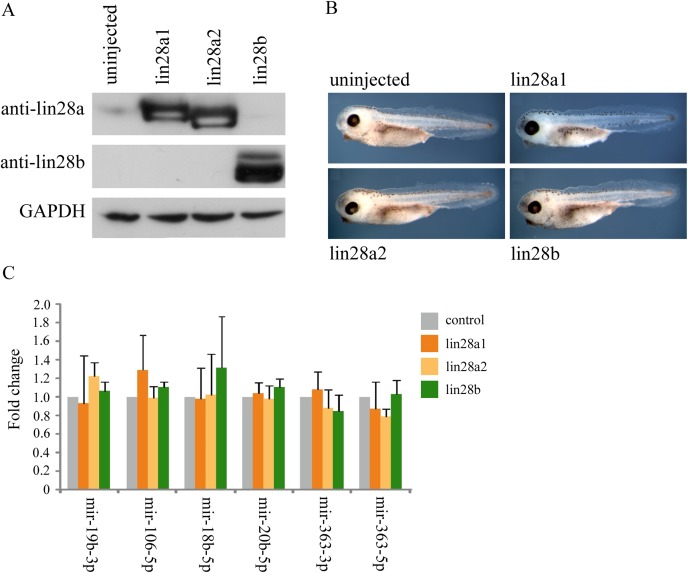
Figure 2.

A: Western blot analysis of lin28 proteins at stage 10.5 in control embryos and embryos injected with 1 ng of mRNAs coding for either lin28a1, lin28a2 or lin28b. GAPDH was used as a loading control. B: Phenotype of control embryos and embryos overexpressing either lin28a1, lin28a2, or lin28b at stage 38. C: qRT‐PCR was performed on embryos injected with control embryos and either 1 ng of mRNAs coding for lin28a1, a2 or b MOs at stage 10.5. Fold change in expression of miRNAs is shown compared with controls and normalised using U6 by the 2‐ΔΔCt method. Fold change is given as average of 3 biological replicates, with error bars representing SE.
