Figure 6.

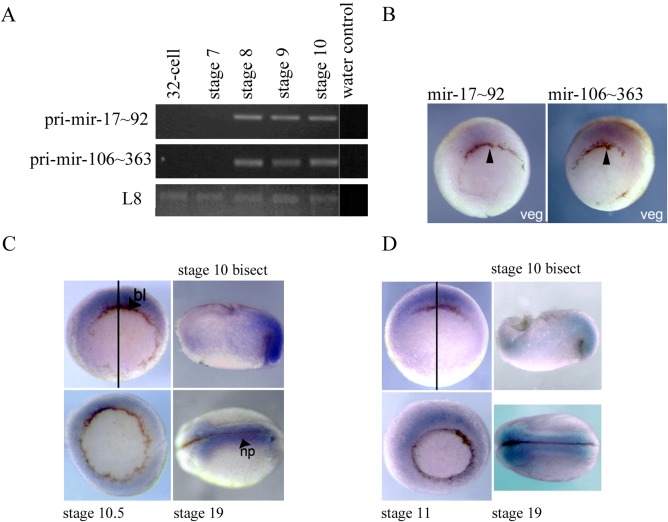
A: Developmental time course for expression of pri‐miR‐17∼92 and pri‐miR‐106∼363 was undertaken using RT‐PCR. L8 was used as a loading control. Image is representative of n=2. miR‐17‐92 = 669 bp, miR‐106‐363 = 639 bp, L8 = 435 bp. B: In situ hybridisations showing expression of pri‐miR‐17∼92 and pri‐miR‐106∼363 RNAs in early development. Vegetal views of early gastrula stage 10.5 embryos, with the dorsal side is to the top. Arrows indicate the dorsal blastopore lip. C: In situ hybridisation using an anti‐sense LNA probe showing mir‐363‐3p expression in early development. Vegetal views of gastrula stages 10 and 10.5 are shown, with dorsal‐side to the top. An animal to vegetal bisect of a stage 10 embryo is shown with the animal hemisphere to the top and dorsal to the right. A dorsal view of a late neurula stage 19 embryo, anterior to the left. Plane of bisection (black line), dorsal blastopore lip (bl) and neural plate (np) are indicated. D: In situ hybridisation using an anti‐sense LNA probe showing mir‐363‐5p expression in early development. Vegetal views of gastrula stages 10 and 11 are shown, with dorsal‐side to the top. An animal to vegetal bisect of a stage 10 embryo is shown with the animal hemisphere to the top and dorsal to the right. A dorsal view of a late neurula stage 19 embryo, anterior to the left. Plane of bisection (black line) is indicated.
