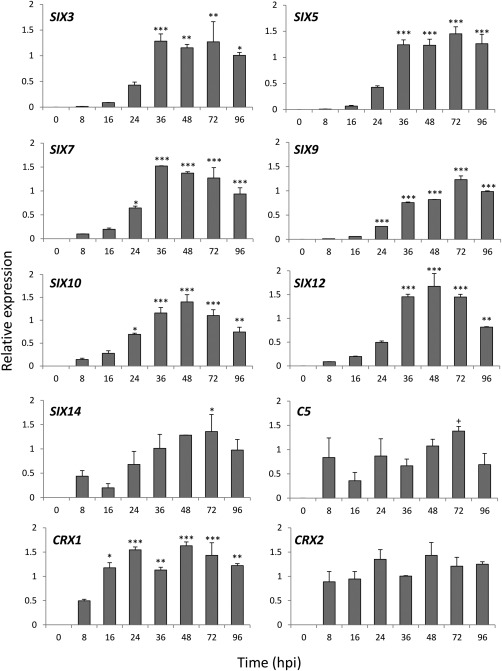
Figure 7.

Quantitative expression of a set of putative effector genes in onion roots following inoculation with Fusarium oxysporum f. sp. cepae (FOC) isolate FUS2. Expression was calculated relative to translation elongation factor 1α (EF‐1α) and β‐tubulin (TUB2). Error bars show the standard error of the mean (SEM) of three replicates; hpi, hours post‐inoculation. Asterisks indicate expression levels significantly different from 8 hpi based on analysis of variance (ANOVA) followed by Tukey's test (*P < 0.05, **P < 0.01, ***P < 0.001). + indicates that the expression of C5 was significantly higher at 72 hpi relative to 16 hpi (P < 0.05).
