
Figure 4.
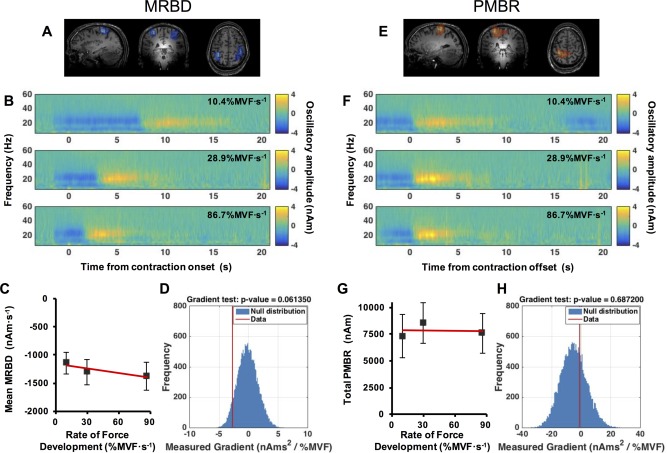
Results of the ramp experiment. (A/E) Spatial signatures of MRBD (A) and PMBR (E) in a single subject. (B/F) Time‐frequency spectrograms extracted from locations of interest at the peak MRBD (B) and PMBR (F); upper to lower panels represent (prescribed) 10.4%MVF·s−1, 28.9%MVF·s−1, and 86.7%MVF·s−1 contractions. Note that for MRBD, time zero indicates contraction onset; for PMBR, time zero indicates contraction offset. (C/G) Mean MRBD during the contraction (C) and total PMBR integral over the 10 s post contraction period (G) plotted against RFD. (D/H) The null distribution (blue) with the measured MRBD (D) and PMBR (H) gradient from real data overlaid in red. Note no significant modulation of either MRBD or PMBR with RFD. [Color figure can be viewed in the online issue, which is available at http://wileyonlinelibrary.com.]