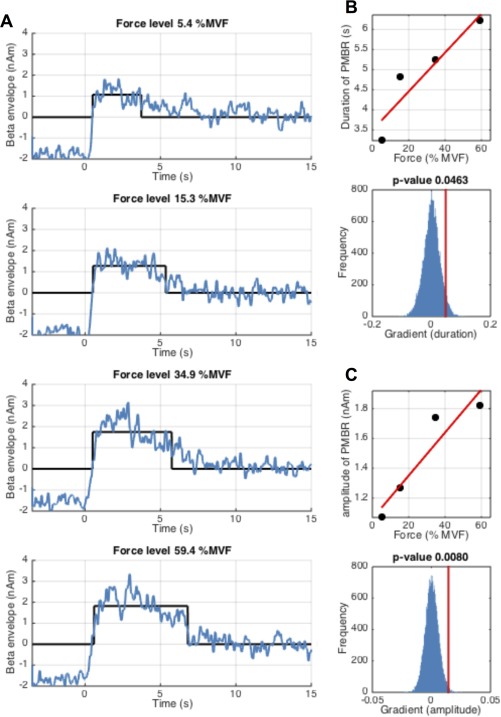
Figure 5.

Measurement of PMBR amplitude and duration during the constant‐force experiment. (A) Shows the average beta band envelope time‐courses (blue) for each of the four force outputs; time t = 0 denotes contraction offset. The black lines show the estimated duration and mean amplitude of the PMBR. (B) Duration of PMBR plotted against force output (upper panel) and the measured gradient (PMBR duration against force) (red line) alongside the null distribution in blue (lower panel). (C) Mean amplitude of PMBR plotted against force output (upper panel) and the measured gradient (PMBR amplitude against force) (red line) alongside the null distribution in blue (lower panel). Note that whilst amplitude of PMBR increases significantly with force output, duration fails to reach significance following FDR correction. [Color figure can be viewed in the online issue, which is available at http://wileyonlinelibrary.com.]
