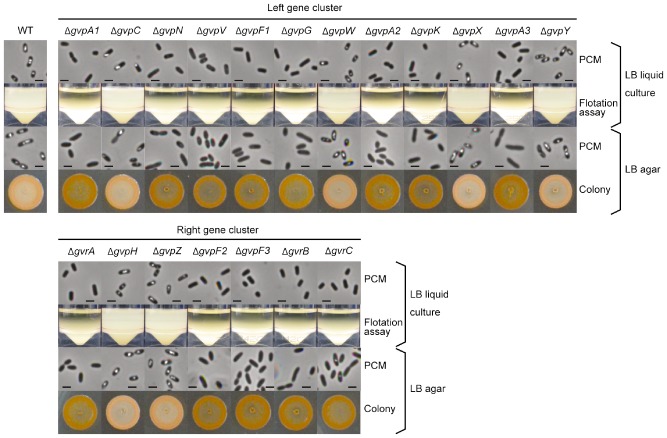
Figure 3.

Comprehensive mutational analysis of the gas vesicle production locus. Gas vesicle production in the WT and each gvp or gvr mutant was assessed throughout both the gvpA1 operon (top section) and gvrA operon (bottom section). Cells were grown in LB in sealed universals or on LB agar at 30°C for 24 h. Gas vesicle formation was confirmed by PCM observations from liquid culture (top row), flotation assays from liquid culture (second row), PCM from colonies grown on plates (third row) or colony morphology (fourth row). The scale bars in the PCM images represent 1 μm.
