
Figure 2.
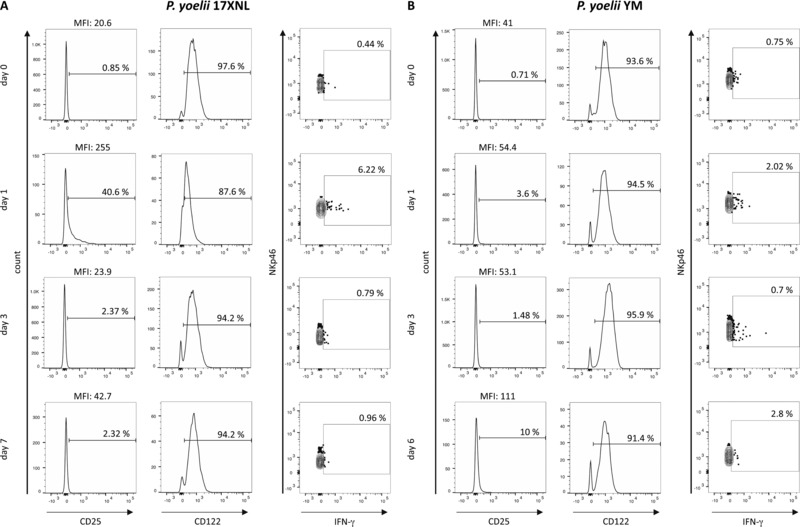
Expression of CD25 and IFN‐γ by splenic NK cells during nonlethal P. yoelii infection. Representative flow cytometry histograms of CD122 and CD25 expression and dot plots of IFN‐γ expression by NK cells (NKp46+CD3ε−) on days 0, 1, 3, and 6 or 7 after infection with (A) P. yoelii 17XNL or (B) P. yoelii YM. The gating strategy was as shown in Figure 1C. The percentages of positive cells and the MFI of the entire NKp46+ population are shown.