
Figure 3.
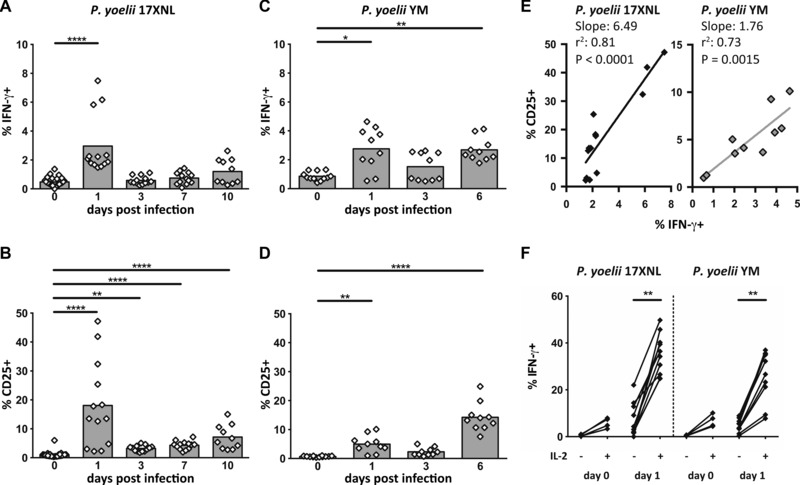
Association between NK‐cell expression of CD25 and IFN‐γ during lethal and nonlethal P. yoelii infection. (A–D) Mice were infected with (A, B) P. yoelii 17XNL or (C, D) P. yoelii YM and splenic NK cells were analyzed ex vivo in the first 6–10 days of infection for expression of IFN‐γ (A, C) and CD25 (B, D) by flow cytometry. The gating strategy was as shown in Figure 1C. (E) Correlation between ex vivo IFN‐γ and CD25 expression among NK cells collected on day 1 p.i. (Py17XNL filled diamonds; PyYM gray diamonds). (F) Percentage of splenic NK cells from uninfected (d0) or 1 day p.i. (d1) mice expressing IFN‐γ after coculture for 4 h with or without 100 ng/mL exogenous rIL‐2 (with Brefeldin A present for the last 3 h). Data points for individual mice, pooled from two (PyYM) or three (Py17XNL) independent experiments are shown (n = 10 for PyYM and n = 13 for Py17XNL). The Kruskal–Wallis plus Dunn's post‐test was used to compare experimental animals versus control (d0) animals (A–D) and the Wilcoxon test was used to compare IL‐2‐stimulated and unstimulated samples (F). *p < 0.05, **p < 0.01, ***p < 0.001, ****p < 0.0001.