
Figure 4.
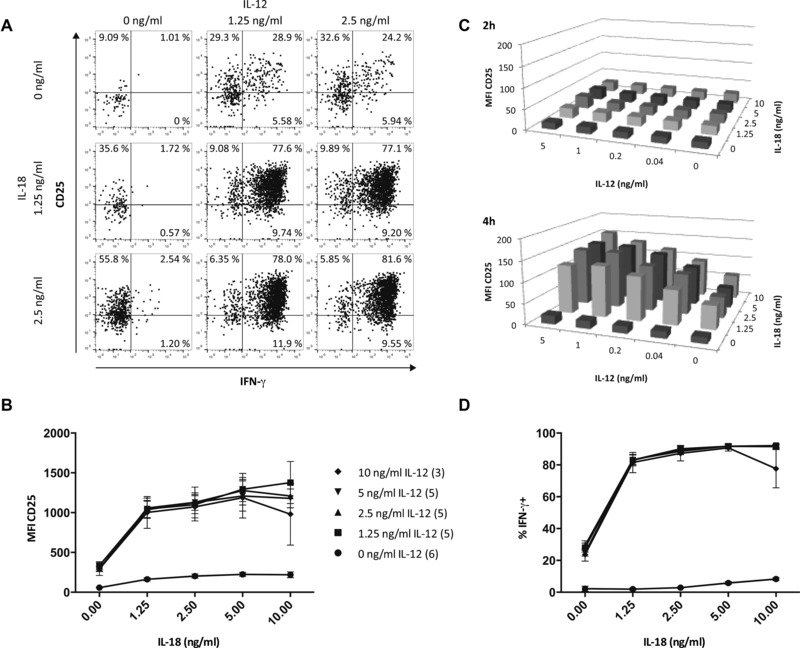
CD25 expression on NK cells is induced in vitro by IL‐12 and IL‐18. Splenocytes from naïve, uninfected mice were incubated with varying concentrations of recombinant IL‐12 and IL‐18 for 2–6 h and analyzed for CD25 and IFN‐γ expression by flow cytometry. (A) Representative dot plots of CD25 and IFN‐γ expression on NK cells after 6‐h stimulation with indicated concentrations of IL‐12 and IL‐18. The gating strategy was as shown in Figure 1C with additional gating on CD122 to ensure expression of the high‐affinity IL‐2R. Numbers in each quadrant denote the percentage of NK cells expressing CD25 and/or IFN‐γ. (B) Median MFI CD25 of NK cells after stimulation for 6 h with varying concentrations of IL‐12 and IL‐18. Data are from one of three independent experiments; the number of samples tested at each concentration is indicated in parentheses in the key. (C) CD25 expression levels (median MFI) on NK cells after 2‐ and 4‐h stimulation with varying concentrations of IL‐12 and IL‐18. Data from one of two independent experiments are shown (n = 5). (D) Proportion of IFN‐γ‐producing NK cells after stimulation for 6 h with varying concentrations of IL‐12 and IL‐18. Data are from one of three independent experiments. The number of samples tested at each concentration is indicated in the key of (B).