Figure 3.

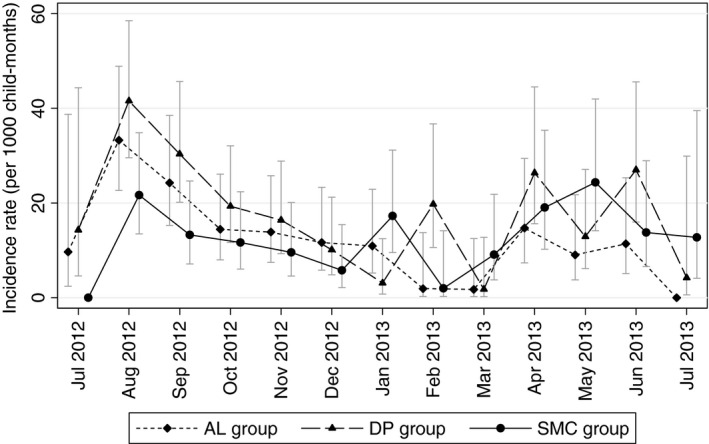
Monthly incidence of malaria by arm over the study period. Monthly incidence of malaria by study group. Error bars show 95% confidence intervals.

Monthly incidence of malaria by arm over the study period. Monthly incidence of malaria by study group. Error bars show 95% confidence intervals.